- Canada
- /
- Professional Services
- /
- TSX:IBG
Why Investors Shouldn't Be Surprised By IBI Group Inc.'s (TSE:IBG) Low P/E

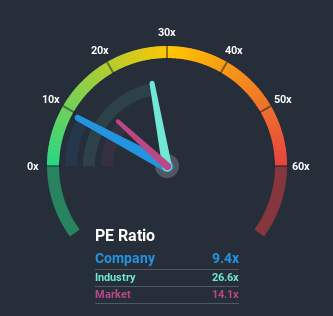
When close to half the companies in Canada have price-to-earnings ratios (or "P/E's") above 15x, you may consider IBI Group Inc. (TSE:IBG) as an attractive investment with its 9.4x P/E ratio. However, the P/E might be low for a reason and it requires further investigation to determine if it's justified.
Recent times have been advantageous for IBI Group as its earnings have been rising faster than most other companies. One possibility is that the P/E is low because investors think this strong earnings performance might be less impressive moving forward. If you like the company, you'd be hoping this isn't the case so that you could potentially pick up some stock while it's out of favour.
View our latest analysis for IBI Group
Where Does IBI Group's P/E Sit Within Its Industry?
We'd like to see if P/E's within IBI Group's industry might provide some colour around the company's low P/E ratio. It turns out the Professional Services industry in general has a P/E ratio significantly higher than the market, as the graphic below shows. So unfortunately this doesn't provide much to explain the company's ratio at all right now. In the context of the Professional Services industry's current setting, most of its constituents' P/E's would be expected to be raised up greatly. Still, the strength of the company's earnings will most likely determine where its P/E shall sit.

What Are Growth Metrics Telling Us About The Low P/E?
IBI Group's P/E ratio would be typical for a company that's only expected to deliver limited growth, and importantly, perform worse than the market.
Taking a look back first, we see that the company grew earnings per share by an impressive 31% last year. Pleasingly, EPS has also lifted 61% in aggregate from three years ago, thanks to the last 12 months of growth. Accordingly, shareholders would have probably welcomed those medium-term rates of earnings growth.
Turning to the outlook, the next year should bring plunging returns, with earnings decreasing 17% as estimated by the five analysts watching the company. The market is also set to see earnings decline 7.4% but the stock is shaping up to perform materially worse.
In light of this, it's understandable that IBI Group's P/E sits below the majority of other companies. Nonetheless, with earnings going quickly in reverse, it's not guaranteed that the P/E has found a floor yet. There's potential for the P/E to fall to even lower levels if the company doesn't improve its profitability.
The Key Takeaway
The price-to-earnings ratio's power isn't primarily as a valuation instrument but rather to gauge current investor sentiment and future expectations.
As we suspected, our examination of IBI Group's analyst forecasts revealed that its even shakier outlook against the market is contributing to its low P/E. At this stage investors feel the potential for an improvement in earnings isn't great enough to justify a higher P/E ratio. Although, we would be concerned whether the company can even maintain this level of performance under these tough market conditions. For now though, it's hard to see the share price rising strongly in the near future under these circumstances.
You should always think about risks. Case in point, we've spotted 2 warning signs for IBI Group you should be aware of.
It's important to make sure you look for a great company, not just the first idea you come across. So take a peek at this free list of interesting companies with strong recent earnings growth (and a P/E ratio below 20x).
If you decide to trade IBI Group, use the lowest-cost* platform that is rated #1 Overall by Barron’s, Interactive Brokers. Trade stocks, options, futures, forex, bonds and funds on 135 markets, all from a single integrated account. Promoted
If you're looking to trade IBI Group, open an account with the lowest-cost platform trusted by professionals, Interactive Brokers.
With clients in over 200 countries and territories, and access to 160 markets, IBKR lets you trade stocks, options, futures, forex, bonds and funds from a single integrated account.
Enjoy no hidden fees, no account minimums, and FX conversion rates as low as 0.03%, far better than what most brokers offer.
Sponsored ContentNew: AI Stock Screener & Alerts
Our new AI Stock Screener scans the market every day to uncover opportunities.
• Dividend Powerhouses (3%+ Yield)
• Undervalued Small Caps with Insider Buying
• High growth Tech and AI Companies
Or build your own from over 50 metrics.
This article by Simply Wall St is general in nature. It does not constitute a recommendation to buy or sell any stock, and does not take account of your objectives, or your financial situation. We aim to bring you long-term focused analysis driven by fundamental data. Note that our analysis may not factor in the latest price-sensitive company announcements or qualitative material. Simply Wall St has no position in any stocks mentioned.
*Interactive Brokers Rated Lowest Cost Broker by StockBrokers.com Annual Online Review 2020
Have feedback on this article? Concerned about the content? Get in touch with us directly. Alternatively, email editorial-team@simplywallst.com.
About TSX:IBG
IBI Group
IBI Group Inc. provides various professional services in Canada, the United States, the United Kingdom, and internationally.
Outstanding track record with excellent balance sheet.
Market Insights
Community Narratives


