
Advertisement
- Canada
- /
- Commercial Services
- /
- TSX:BYD
Should You Use Boyd Group Services's (TSE:BYD) Statutory Earnings To Analyse It?
As a general rule, we think profitable companies are less risky than companies that lose money. However, sometimes companies receive a one-off boost (or reduction) to their profit, and it's not always clear whether statutory profits are a good guide, going forward. Today we'll focus on whether this year's statutory profits are a good guide to understanding Boyd Group Services (TSE:BYD).
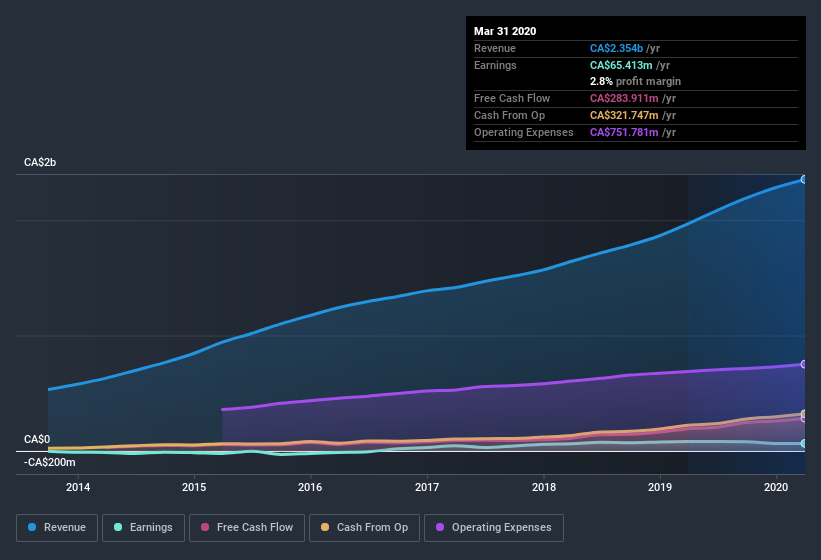
It's good to see that over the last twelve months Boyd Group Services made a profit of CA$65.4m on revenue of CA$2.35b. In the chart below, you can see that its profit and revenue have both grown over the last three years, although its profit has slipped in the last twelve months.
See our latest analysis for Boyd Group Services
Not all profits are equal, and we can learn more about the nature of a company's past profitability by diving deeper into the financial statements. As a result, we'll today take a look at how dilution and cashflow shape our understanding of Boyd Group Services's earnings. That might leave you wondering what analysts are forecasting in terms of future profitability. Luckily, you can click here to see an interactive graph depicting future profitability, based on their estimates.
Zooming In On Boyd Group Services's Earnings
In high finance, the key ratio used to measure how well a company converts reported profits into free cash flow (FCF) is the accrual ratio (from cashflow). To get the accrual ratio we first subtract FCF from profit for a period, and then divide that number by the average operating assets for the period. The ratio shows us how much a company's profit exceeds its FCF.
That means a negative accrual ratio is a good thing, because it shows that the company is bringing in more free cash flow than its profit would suggest. That is not intended to imply we should worry about a positive accrual ratio, but it's worth noting where the accrual ratio is rather high. To quote a 2014 paper by Lewellen and Resutek, "firms with higher accruals tend to be less profitable in the future".
Over the twelve months to March 2020, Boyd Group Services recorded an accrual ratio of -0.22. That implies it has very good cash conversion, and that its earnings in the last year actually significantly understate its free cash flow. Indeed, in the last twelve months it reported free cash flow of CA$284m, well over the CA$65.4m it reported in profit. Boyd Group Services's free cash flow improved over the last year, which is generally good to see. Notably, the company has issued new shares, thus diluting existing shareholders and reducing their share of future earnings.
In order to understand the potential for per share returns, it is essential to consider how much a company is diluting shareholders. In fact, Boyd Group Services increased the number of shares on issue by 8.1% over the last twelve months by issuing new shares. That means its earnings are split among a greater number of shares. To celebrate net income while ignoring dilution is like rejoicing because you have a single slice of a larger pizza, but ignoring the fact that the pizza is now cut into many more slices. Check out Boyd Group Services's historical EPS growth by clicking on this link.
A Look At The Impact Of Boyd Group Services's Dilution on Its Earnings Per Share (EPS).
As you can see above, Boyd Group Services has been growing its net income over the last few years, with an annualized gain of 46% over three years. In comparison, earnings per share only gained 32% over the same period. Net profit actually dropped by 19% in the last year. Unfortunately for shareholders, though, the earnings per share result was even worse, declining 20%. So you can see that the dilution has had a bit of an impact on shareholders. Therefore, the dilution is having a noteworthy influence on shareholder returns. And so, you can see quite clearly that dilution is influencing shareholder earnings.
In the long term, if Boyd Group Services's earnings per share can increase, then the share price should too. However, if its profit increases while its earnings per share stay flat (or even fall) then shareholders might not see much benefit. For that reason, you could say that EPS is more important that net income in the long run, assuming the goal is to assess whether a company's share price might grow.
Our Take On Boyd Group Services's Profit Performance
In conclusion, Boyd Group Services has a strong cashflow relative to earnings, which indicates good quality earnings, but the dilution means its earnings per share are dropping faster than its profit. Based on these factors, we think that Boyd Group Services's profits are a reasonably conservative guide to its underlying profitability. So while earnings quality is important, it's equally important to consider the risks facing Boyd Group Services at this point in time. You'd be interested to know, that we found 5 warning signs for Boyd Group Services and you'll want to know about these.
In this article we've looked at a number of factors that can impair the utility of profit numbers, as a guide to a business. But there are plenty of other ways to inform your opinion of a company. For example, many people consider a high return on equity as an indication of favorable business economics, while others like to 'follow the money' and search out stocks that insiders are buying. While it might take a little research on your behalf, you may find this free collection of companies boasting high return on equity, or this list of stocks that insiders are buying to be useful.
When trading Boyd Group Services or any other investment, use the platform considered by many to be the Professional's Gateway to the Worlds Market, Interactive Brokers. You get the lowest-cost* trading on stocks, options, futures, forex, bonds and funds worldwide from a single integrated account.Promoted
Valuation is complex, but we're here to simplify it.
Discover if Boyd Group Services might be undervalued or overvalued with our detailed analysis, featuring fair value estimates, potential risks, dividends, insider trades, and its financial condition.
Access Free AnalysisThis article by Simply Wall St is general in nature. It does not constitute a recommendation to buy or sell any stock, and does not take account of your objectives, or your financial situation. We aim to bring you long-term focused analysis driven by fundamental data. Note that our analysis may not factor in the latest price-sensitive company announcements or qualitative material. Simply Wall St has no position in any stocks mentioned.
*Interactive Brokers Rated Lowest Cost Broker by StockBrokers.com Annual Online Review 2020
Have feedback on this article? Concerned about the content? Get in touch with us directly. Alternatively, email editorial-team@simplywallst.com.
About TSX:BYD
Boyd Group Services
Operates non-franchised collision repair centers in North America.
Good value with reasonable growth potential.
Market Insights

Advertisement
Weekly Picks
RO


RockeTeller on Santacruz Silver Mining ·
Crazy Undervalued 42 Baggers Silver Play (Active & Running Mine)
Fair Value:CA$8696.7% undervalued
60 followersusers have followed this narrative
7 commentsusers have commented on this narrative
17 likesusers have liked this narrative
RO


Robbo on Fiducian Group ·
Fiducian: Compliance Clouds or Value Opportunity?
Fair Value:AU$122.0% undervalued
9 followersusers have followed this narrative
0 commentsusers have commented on this narrative
0 likesusers have liked this narrative
WO

woodworthfund on Willamette Valley Vineyards ·
Willamette Valley Vineyards (WVVI): Not-So-Great Value
Fair Value:US$242.5% overvalued
10 followersusers have followed this narrative
0 commentsusers have commented on this narrative
1 likeusers have liked this narrative
Recently Updated Narratives
WO

woodworthfund on MGP Ingredients ·
THE KINGDOM OF BROWN GOODS: WHY MGPI IS BEING CRUSHED BY INVENTORY & PRIMED FOR RESURRECTION
Fair Value:US$4035.8% undervalued
3 followersusers have followed this narrative
0 commentsusers have commented on this narrative
0 likesusers have liked this narrative
DA


davidlsander on Beam Therapeutics ·
The "Molecular Pencil": Why Beam's Technology is Built to Win
Fair Value:US$15081.9% undervalued
52 followersusers have followed this narrative
3 commentsusers have commented on this narrative
1 likeusers have liked this narrative
MO


mo7md on ADNOC Gas ·
ADNOC Gas future shines with a 21.4% revenue surge
Fair Value:د.إ3.728.9% undervalued
3 followersusers have followed this narrative
0 commentsusers have commented on this narrative
0 likesusers have liked this narrative
Popular Narratives
TH


TheWallstreetKing on MicroVision ·
MicroVision will explode future revenue by 380.37% with a vision towards success
Fair Value:US$6098.5% undervalued
117 followersusers have followed this narrative
11 commentsusers have commented on this narrative
22 likesusers have liked this narrative
AN


AnalystConsensusTarget on NVIDIA ·
NVDA: Expanding AI Demand Will Drive Major Data Center Investments Through 2026
Fair Value:US$250.3927.2% undervalued
959 followersusers have followed this narrative
6 commentsusers have commented on this narrative
25 likesusers have liked this narrative
RO
RockeTeller on Santacruz Silver Mining ·
Crazy Undervalued 42 Baggers Silver Play (Active & Running Mine)
Fair Value:CA$8696.7% undervalued
60 followersusers have followed this narrative
7 commentsusers have commented on this narrative
17 likesusers have liked this narrative
