- Canada
- /
- Commercial Services
- /
- TSX:BYD
Should You Use Boyd Group Services's (TSE:BYD) Statutory Earnings To Analyse It?


It might be old fashioned, but we really like to invest in companies that make a profit, each and every year. Having said that, sometimes statutory profit levels are not a good guide to ongoing profitability, because some short term one-off factor has impacted profit levels. Today we'll focus on whether this year's statutory profits are a good guide to understanding Boyd Group Services (TSE:BYD).
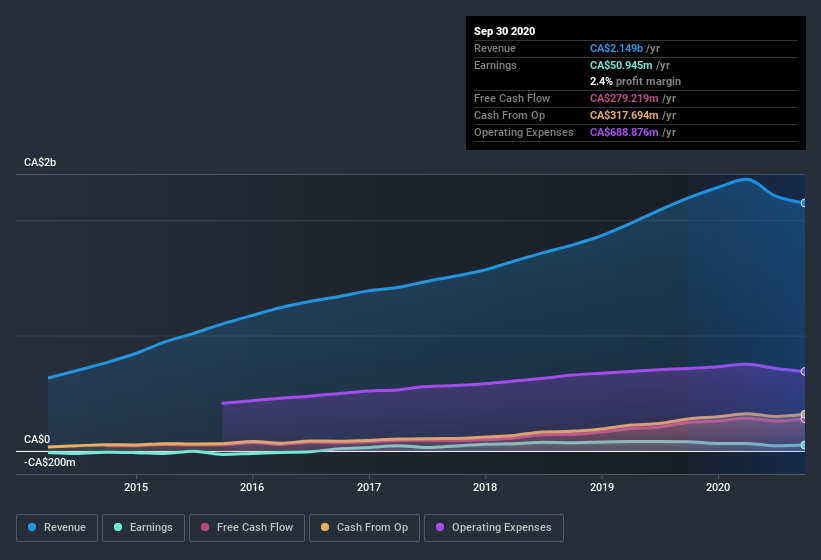
It's good to see that over the last twelve months Boyd Group Services made a profit of CA$50.9m on revenue of CA$2.15b. Happily, it has grown both its profit and revenue over the last three years (but not in the last year), as you can see in the chart below.
Check out our latest analysis for Boyd Group Services
Importantly, statutory profits are not always the best tool for understanding a company's true earnings power, so it's well worth examining profits in a little more detail. So today we'll examine what Boyd Group Services' cashflow and its expanding share count tell us about the nature of its profits. That might leave you wondering what analysts are forecasting in terms of future profitability. Luckily, you can click here to see an interactive graph depicting future profitability, based on their estimates.
Examining Cashflow Against Boyd Group Services' Earnings
In high finance, the key ratio used to measure how well a company converts reported profits into free cash flow (FCF) is the accrual ratio (from cashflow). The accrual ratio subtracts the FCF from the profit for a given period, and divides the result by the average operating assets of the company over that time. You could think of the accrual ratio from cashflow as the 'non-FCF profit ratio'.
That means a negative accrual ratio is a good thing, because it shows that the company is bringing in more free cash flow than its profit would suggest. While having an accrual ratio above zero is of little concern, we do think it's worth noting when a company has a relatively high accrual ratio. Notably, there is some academic evidence that suggests that a high accrual ratio is a bad sign for near-term profits, generally speaking.
Over the twelve months to September 2020, Boyd Group Services recorded an accrual ratio of -0.23. That implies it has very good cash conversion, and that its earnings in the last year actually significantly understate its free cash flow. To wit, it produced free cash flow of CA$279m during the period, dwarfing its reported profit of CA$50.9m. Boyd Group Services' free cash flow improved over the last year, which is generally good to see. Notably, the company has issued new shares, thus diluting existing shareholders and reducing their share of future earnings.
One essential aspect of assessing earnings quality is to look at how much a company is diluting shareholders. Boyd Group Services expanded the number of shares on issue by 6.3% over the last year. Therefore, each share now receives a smaller portion of profit. To talk about net income, without noticing earnings per share, is to be distracted by the big numbers while ignoring the smaller numbers that talk to per share value. You can see a chart of Boyd Group Services' EPS by clicking here.
A Look At The Impact Of Boyd Group Services' Dilution on Its Earnings Per Share (EPS).
As you can see above, Boyd Group Services has been growing its net income over the last few years, with an annualized gain of 16% over three years. In comparison, earnings per share only gained 2.6% over the same period. Net profit actually dropped by 36% in the last year. But the EPS result was even worth, with the company recording a decline of 38%. So you can see that the dilution has had a bit of an impact on shareholders. Therefore, the dilution is having a noteworthy influence on shareholder returns. And so, you can see quite clearly that dilution is influencing shareholder earnings.
In the long term, if Boyd Group Services' earnings per share can increase, then the share price should too. But on the other hand, we'd be far less excited to learn profit (but not EPS) was improving. For that reason, you could say that EPS is more important that net income in the long run, assuming the goal is to assess whether a company's share price might grow.
Our Take On Boyd Group Services' Profit Performance
In conclusion, Boyd Group Services has a strong cashflow relative to earnings, which indicates good quality earnings, but the dilution means its earnings per share are dropping faster than its profit. Based on these factors, we think that Boyd Group Services' profits are a reasonably conservative guide to its underlying profitability. Keep in mind, when it comes to analysing a stock it's worth noting the risks involved. You'd be interested to know, that we found 3 warning signs for Boyd Group Services and you'll want to know about these.
Our examination of Boyd Group Services has focussed on certain factors that can make its earnings look better than they are. But there is always more to discover if you are capable of focussing your mind on minutiae. Some people consider a high return on equity to be a good sign of a quality business. While it might take a little research on your behalf, you may find this free collection of companies boasting high return on equity, or this list of stocks that insiders are buying to be useful.
When trading Boyd Group Services or any other investment, use the platform considered by many to be the Professional's Gateway to the Worlds Market, Interactive Brokers. You get the lowest-cost* trading on stocks, options, futures, forex, bonds and funds worldwide from a single integrated account. Promoted
Valuation is complex, but we're here to simplify it.
Discover if Boyd Group Services might be undervalued or overvalued with our detailed analysis, featuring fair value estimates, potential risks, dividends, insider trades, and its financial condition.
Access Free AnalysisThis article by Simply Wall St is general in nature. It does not constitute a recommendation to buy or sell any stock, and does not take account of your objectives, or your financial situation. We aim to bring you long-term focused analysis driven by fundamental data. Note that our analysis may not factor in the latest price-sensitive company announcements or qualitative material. Simply Wall St has no position in any stocks mentioned.
*Interactive Brokers Rated Lowest Cost Broker by StockBrokers.com Annual Online Review 2020
Have feedback on this article? Concerned about the content? Get in touch with us directly. Alternatively, email editorial-team (at) simplywallst.com.
About TSX:BYD
Boyd Group Services
Operates non-franchised collision repair centers in North America.
Reasonable growth potential and fair value.
Market Insights

Community Narratives

