
Advertisement
Could Goodfellow Inc. (TSE:GDL) be an attractive dividend share to own for the long haul? Investors are often drawn to strong companies with the idea of reinvesting the dividends. Yet sometimes, investors buy a popular dividend stock because of its yield, and then lose money if the company's dividend doesn't live up to expectations.
A high yield and a long history of paying dividends is an appealing combination for Goodfellow. It would not be a surprise to discover that many investors buy it for the dividends. Some simple research can reduce the risk of buying Goodfellow for its dividend - read on to learn more.
Explore this interactive chart for our latest analysis on Goodfellow!
Payout ratios
Companies (usually) pay dividends out of their earnings. If a company is paying more than it earns, the dividend might have to be cut. As a result, we should always investigate whether a company can afford its dividend, measured as a percentage of a company's net income after tax. Looking at the data, we can see that 57% of Goodfellow's profits were paid out as dividends in the last 12 months. This is a healthy payout ratio, and while it does limit the amount of earnings that can be reinvested in the business, there is also some room to lift the payout ratio over time.
Another important check we do is to see if the free cash flow generated is sufficient to pay the dividend. Goodfellow's cash payout ratio last year was 7.2%, which is quite low and suggests that the dividend was thoroughly covered by cash flow. It's positive to see that Goodfellow's dividend is covered by both profits and cash flow, since this is generally a sign that the dividend is sustainable, and a lower payout ratio usually suggests a greater margin of safety before the dividend gets cut.
Is Goodfellow's Balance Sheet Risky?
As Goodfellow has a meaningful amount of debt, we need to check its balance sheet to see if the company might have debt risks. A rough way to check this is with these two simple ratios: a) net debt divided by EBITDA (earnings before interest, tax, depreciation and amortisation), and b) net interest cover. Net debt to EBITDA measures total debt load relative to company earnings (lower = less debt), while net interest cover measures the ability to pay interest on the debt (higher = greater ability to pay interest costs). Goodfellow has net debt of 5.43 times its EBITDA, which implies meaningful risk if interest rates rise of earnings decline.
We calculated its interest cover by measuring its earnings before interest and tax (EBIT), and dividing this by the company's net interest expense. With EBIT of 3.12 times its interest expense, Goodfellow's interest cover is starting to look a bit thin. High debt and weak interest cover are not a great combo, and we would be cautious of relying on this company's dividend while these metrics persist.
We update our data on Goodfellow every 24 hours, so you can always get our latest analysis of its financial health, here.
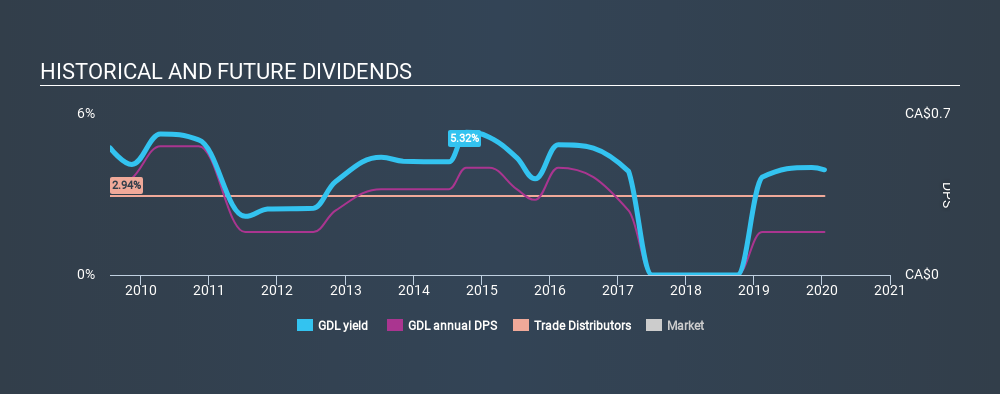
Dividend Volatility
Before buying a stock for its income, we want to see if the dividends have been stable in the past, and if the company has a track record of maintaining its dividend. Goodfellow has been paying dividends for a long time, but for the purpose of this analysis, we only examine the past 10 years of payments. This dividend has been unstable, which we define as having been cut one or more times over this time. During the past ten-year period, the first annual payment was CA$0.40 in 2010, compared to CA$0.20 last year. The dividend has shrunk at around 6.7% a year during that period. Goodfellow's dividend hasn't shrunk linearly at 6.7% per annum, but the CAGR is a useful estimate of the historical rate of change.
A shrinking dividend over a ten-year period is not ideal, and we'd be concerned about investing in a dividend stock that lacks a solid record of growing dividends per share.
Dividend Growth Potential
With a relatively unstable dividend, and a poor history of shrinking dividends, it's even more important to see if EPS are growing. Goodfellow's earnings per share have shrunk at 12% a year over the past five years. A sharp decline in earnings per share is not great from from a dividend perspective, as even conservative payout ratios can come under pressure if earnings fall far enough.
Conclusion
When we look at a dividend stock, we need to form a judgement on whether the dividend will grow, if the company is able to maintain it in a wide range of economic circumstances, and if the dividend payout is sustainable. First, we think Goodfellow has an acceptable payout ratio and its dividend is well covered by cashflow. Second, earnings per share have been in decline, and its dividend has been cut at least once in the past. Ultimately, Goodfellow comes up short on our dividend analysis. It's not that we think it is a bad company - just that there are likely more appealing dividend prospects out there on this analysis.
Are management backing themselves to deliver performance? Check their shareholdings in Goodfellow in our latest insider ownership analysis.
If you are a dividend investor, you might also want to look at our curated list of dividend stocks yielding above 3%.
If you spot an error that warrants correction, please contact the editor at editorial-team@simplywallst.com. This article by Simply Wall St is general in nature. It does not constitute a recommendation to buy or sell any stock, and does not take account of your objectives, or your financial situation. Simply Wall St has no position in the stocks mentioned.
We aim to bring you long-term focused research analysis driven by fundamental data. Note that our analysis may not factor in the latest price-sensitive company announcements or qualitative material. Thank you for reading.
About TSX:GDL
Goodfellow
Engages in the wholesale distribution of building materials and floor coverings in Canada, the United States, and the United Kingdom.
Flawless balance sheet average dividend payer.
Market Insights

Advertisement
Weekly Picks
RO


RockeTeller on Santacruz Silver Mining ·
Crazy Undervalued 42 Baggers Silver Play (Active & Running Mine)
Fair Value:CA$8696.7% undervalued
50 followersusers have followed this narrative
6 commentsusers have commented on this narrative
16 likesusers have liked this narrative
RO


Robbo on Fiducian Group ·
Fiducian: Compliance Clouds or Value Opportunity?
Fair Value:AU$122.0% undervalued
7 followersusers have followed this narrative
0 commentsusers have commented on this narrative
0 likesusers have liked this narrative
WO

woodworthfund on Willamette Valley Vineyards ·
Willamette Valley Vineyards (WVVI): Not-So-Great Value
Fair Value:US$247.5% overvalued
9 followersusers have followed this narrative
0 commentsusers have commented on this narrative
1 likeusers have liked this narrative
Recently Updated Narratives
IN

IncomeAssets on Pulse Seismic ·
Watch Pulse Seismic Outperform with 13.6% Revenue Growth in the Coming Years
Fair Value:CA$4.4729.5% undervalued
3 followersusers have followed this narrative
0 commentsusers have commented on this narrative
0 likesusers have liked this narrative
VL

Vladislav on Galleon Gold ·
Significantly undervalued gold explorer in Timmins, finally getting traction
Fair Value:CA$482.8% undervalued
5 followersusers have followed this narrative
0 commentsusers have commented on this narrative
0 likesusers have liked this narrative
FU

FundamentallySarcastic on Credit Corp Group ·
Moderation and Stabilisation: HOLD: Fair Price based on a 4-year Cycle is $12.08
Fair Value:AU$12.6410.8% overvalued
6 followersusers have followed this narrative
0 commentsusers have commented on this narrative
0 likesusers have liked this narrative
Popular Narratives
TH


TheWallstreetKing on MicroVision ·
MicroVision will explode future revenue by 380.37% with a vision towards success
Fair Value:US$6098.5% undervalued
116 followersusers have followed this narrative
11 commentsusers have commented on this narrative
22 likesusers have liked this narrative
AN


AnalystConsensusTarget on NVIDIA ·
NVDA: Expanding AI Demand Will Drive Major Data Center Investments Through 2026
Fair Value:US$250.3926.8% undervalued
956 followersusers have followed this narrative
6 commentsusers have commented on this narrative
25 likesusers have liked this narrative
AN

AnalystConsensusTarget on Alphabet ·
GOOGL: AI Platform Expansion And Cloud Demand Will Support Durable Performance Amid Competitive Pressures
Fair Value:US$323.71.9% undervalued
1341 followersusers have followed this narrative
0 commentsusers have commented on this narrative
17 likesusers have liked this narrative

