- Canada
- /
- Construction
- /
- TSX:ATRL
3 TSX Stocks That May Be Priced Below Their Estimated Worth In October 2024

Reviewed by Simply Wall St

As the Canadian TSX index has experienced a robust 14% rise in the first three quarters of the year, recent market volatility has introduced new challenges due to uncertainties surrounding global tensions and political events. Despite these hurdles, solid economic fundamentals and promising labour market data suggest opportunities for investors to explore stocks that may be priced below their estimated worth. Identifying such stocks involves assessing their intrinsic value against current market conditions, which can offer potential for growth when broader economic indicators remain favorable.
Top 10 Undervalued Stocks Based On Cash Flows In Canada
| Name | Current Price | Fair Value (Est) | Discount (Est) |
| goeasy (TSX:GSY) | CA$182.98 | CA$361.57 | 49.4% |
| Computer Modelling Group (TSX:CMG) | CA$11.95 | CA$21.96 | 45.6% |
| Savaria (TSX:SIS) | CA$22.33 | CA$41.08 | 45.6% |
| Africa Oil (TSX:AOI) | CA$1.87 | CA$3.72 | 49.7% |
| Viemed Healthcare (TSX:VMD) | CA$10.45 | CA$20.08 | 48% |
| Kinaxis (TSX:KXS) | CA$160.30 | CA$281.84 | 43.1% |
| Lithium Royalty (TSX:LIRC) | CA$5.55 | CA$8.81 | 37% |
| Blackline Safety (TSX:BLN) | CA$6.38 | CA$11.02 | 42.1% |
| Boyd Group Services (TSX:BYD) | CA$211.00 | CA$340.13 | 38% |
| Opsens (TSX:OPS) | CA$2.90 | CA$4.64 | 37.5% |
Let's explore several standout options from the results in the screener.
AtkinsRéalis Group (TSX:ATRL)
Overview: AtkinsRéalis is an integrated professional services and project management company with a global presence, holding a market capitalization of CA$10.28 billion.
Operations: The company's revenue segments consist of Capital at CA$127.40 million, Nuclear at CA$1.20 billion, and LSTK Projects at CA$318.44 million.
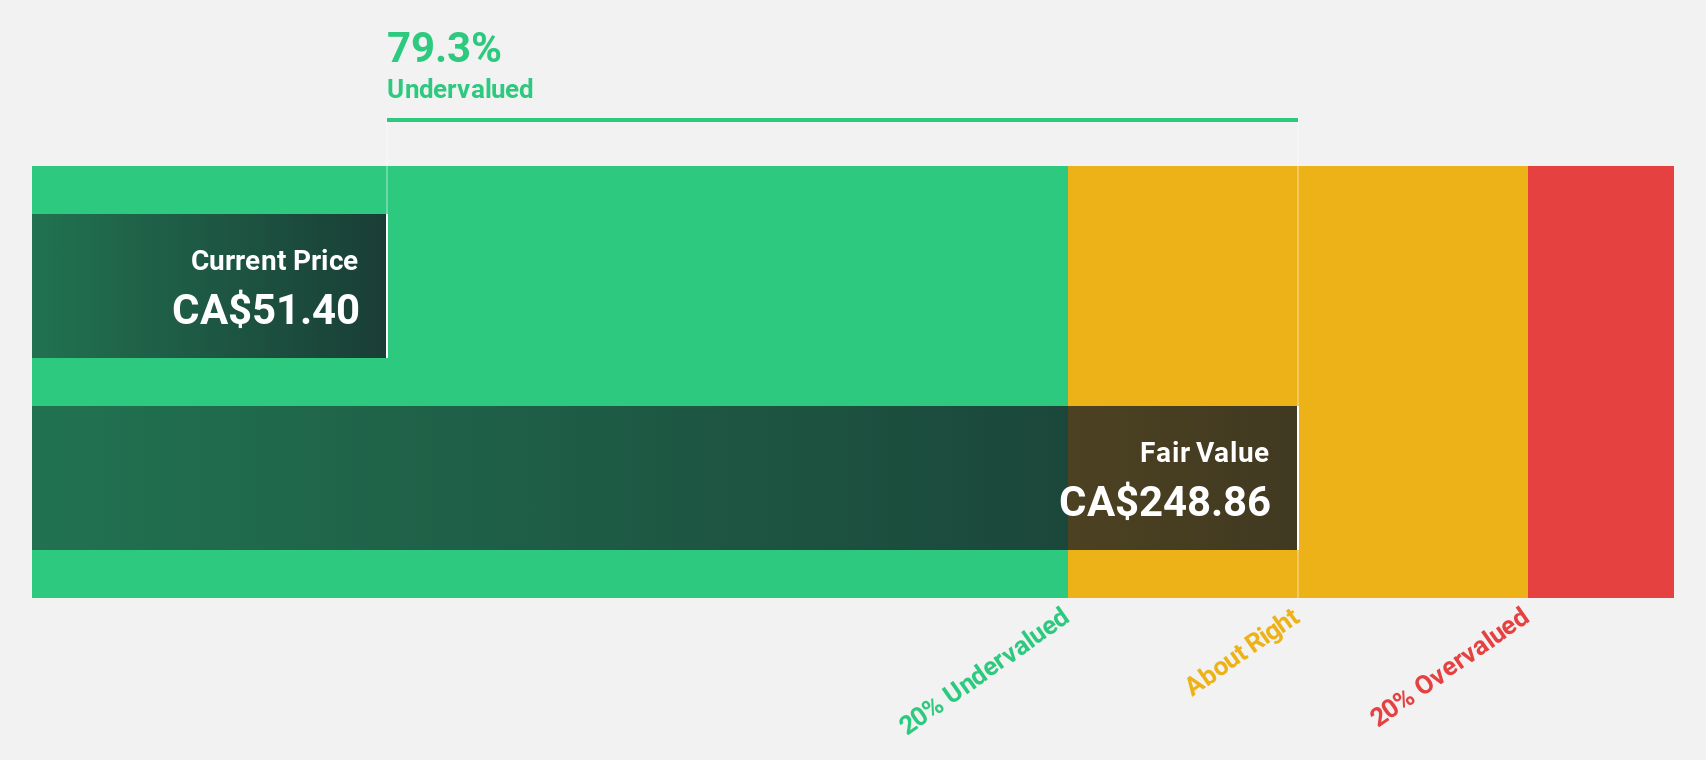
Estimated Discount To Fair Value: 22.9%
AtkinsRéalis Group appears undervalued based on cash flow analysis, trading over 20% below its estimated fair value of CA$77.02. Despite a low forecasted return on equity of 13.5%, the company anticipates significant earnings growth at 26.3% annually, outpacing the Canadian market average. Recent contracts with United Utilities and Network Rail may bolster future cash flows, enhancing its financial position despite current debt coverage concerns by operating cash flow.
- In light of our recent growth report, it seems possible that AtkinsRéalis Group's financial performance will exceed current levels.
- Click here to discover the nuances of AtkinsRéalis Group with our detailed financial health report.

Calian Group (TSX:CGY)
Overview: Calian Group Ltd. offers business services and solutions both in Canada and internationally, with a market cap of CA$546.27 million.
Operations: The company's revenue is derived from four primary segments: ITCS (CA$215.64 million), Health (CA$211.36 million), Learning (CA$106.89 million), and Advanced Technologies (CA$207.51 million).
Estimated Discount To Fair Value: 36.7%
Calian Group trades 36.7% below its estimated fair value of CA$73.02, suggesting undervaluation based on cash flows. Despite a decrease in net income, recent collaborations with Walmart Canada and Microsoft could enhance future cash flow and market position in digital health and cybersecurity sectors. The company's share buyback program may also support stock value, while expected earnings growth at 35.1% annually surpasses the Canadian market average significantly.
- Our comprehensive growth report raises the possibility that Calian Group is poised for substantial financial growth.
- Take a closer look at Calian Group's balance sheet health here in our report.
Paramount Resources (TSX:POU)
Overview: Paramount Resources Ltd. is a Canadian company engaged in the exploration and development of conventional and unconventional petroleum and natural gas reserves, with a market cap of CA$4.11 billion.
Operations: Paramount Resources generates revenue from the exploration and development of both conventional and unconventional petroleum and natural gas reserves in Canada.
Estimated Discount To Fair Value: 16.2%
Paramount Resources is trading at CA$28.5, below its estimated fair value of CA$34.01, highlighting potential undervaluation based on cash flows. Despite a drop in profit margins from 35.2% to 19.7%, earnings are expected to grow significantly at 27.48% annually, outpacing the Canadian market average of 14.5%. However, shareholders have faced dilution recently and dividends are not well covered by free cash flows, which may impact investor sentiment.
- Our growth report here indicates Paramount Resources may be poised for an improving outlook.
- Dive into the specifics of Paramount Resources here with our thorough financial health report.

Seize The Opportunity
- Discover the full array of 25 Undervalued TSX Stocks Based On Cash Flows right here.
- Already own these companies? Link your portfolio to Simply Wall St and get alerts on any new warning signs to your stocks.
- Discover a world of investment opportunities with Simply Wall St's free app and access unparalleled stock analysis across all markets.
Looking For Alternative Opportunities?
- Explore high-performing small cap companies that haven't yet garnered significant analyst attention.
- Diversify your portfolio with solid dividend payers offering reliable income streams to weather potential market turbulence.
- Fuel your portfolio with companies showing strong growth potential, backed by optimistic outlooks both from analysts and management.
This article by Simply Wall St is general in nature. We provide commentary based on historical data and analyst forecasts only using an unbiased methodology and our articles are not intended to be financial advice. It does not constitute a recommendation to buy or sell any stock, and does not take account of your objectives, or your financial situation. We aim to bring you long-term focused analysis driven by fundamental data. Note that our analysis may not factor in the latest price-sensitive company announcements or qualitative material. Simply Wall St has no position in any stocks mentioned.
New: Manage All Your Stock Portfolios in One Place
We've created the ultimate portfolio companion for stock investors, and it's free.
• Connect an unlimited number of Portfolios and see your total in one currency
• Be alerted to new Warning Signs or Risks via email or mobile
• Track the Fair Value of your stocks
Have feedback on this article? Concerned about the content? Get in touch with us directly. Alternatively, email editorial-team@simplywallst.com
About TSX:ATRL
AtkinsRéalis Group
AtkinsRéalis operates as an integrated professional services and project management company worldwide.
Solid track record with reasonable growth potential.
Similar Companies
Market Insights

Community Narratives
