National Bank of Canada (TSE:NA) Has Gifted Shareholders With A Fantastic 116% Total Return On Their Investment


Stock pickers are generally looking for stocks that will outperform the broader market. And in our experience, buying the right stocks can give your wealth a significant boost. For example, the National Bank of Canada (TSE:NA) share price is up 76% in the last 5 years, clearly besting the market return of around 29% (ignoring dividends). On the other hand, the more recent gains haven't been so impressive, with shareholders gaining just 4.0% , including dividends .
View our latest analysis for National Bank of Canada
There is no denying that markets are sometimes efficient, but prices do not always reflect underlying business performance. One imperfect but simple way to consider how the market perception of a company has shifted is to compare the change in the earnings per share (EPS) with the share price movement.
During five years of share price growth, National Bank of Canada achieved compound earnings per share (EPS) growth of 4.7% per year. This EPS growth is lower than the 12% average annual increase in the share price. This suggests that market participants hold the company in higher regard, these days. And that's hardly shocking given the track record of growth.
The company's earnings per share (over time) is depicted in the image below (click to see the exact numbers).
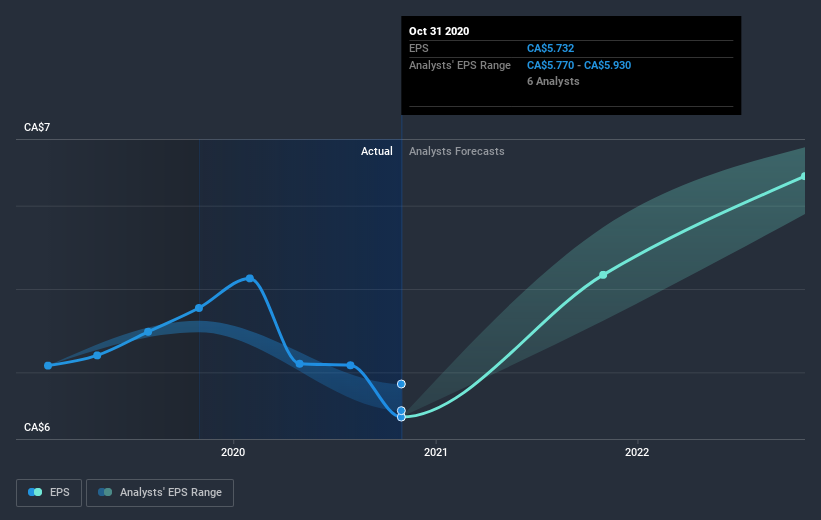
We consider it positive that insiders have made significant purchases in the last year. Having said that, most people consider earnings and revenue growth trends to be a more meaningful guide to the business. It might be well worthwhile taking a look at our free report on National Bank of Canada's earnings, revenue and cash flow.
What About Dividends?
As well as measuring the share price return, investors should also consider the total shareholder return (TSR). The TSR incorporates the value of any spin-offs or discounted capital raisings, along with any dividends, based on the assumption that the dividends are reinvested. Arguably, the TSR gives a more comprehensive picture of the return generated by a stock. In the case of National Bank of Canada, it has a TSR of 116% for the last 5 years. That exceeds its share price return that we previously mentioned. And there's no prize for guessing that the dividend payments largely explain the divergence!
A Different Perspective
National Bank of Canada provided a TSR of 4.0% over the last twelve months. But that was short of the market average. If we look back over five years, the returns are even better, coming in at 17% per year for five years. It's quite possible the business continues to execute with prowess, even as the share price gains are slowing. If you want to research this stock further, the data on insider buying is an obvious place to start. You can click here to see who has been buying shares - and the price they paid.
National Bank of Canada is not the only stock insiders are buying. So take a peek at this free list of growing companies with insider buying.
Please note, the market returns quoted in this article reflect the market weighted average returns of stocks that currently trade on CA exchanges.
If you decide to trade National Bank of Canada, use the lowest-cost* platform that is rated #1 Overall by Barron’s, Interactive Brokers. Trade stocks, options, futures, forex, bonds and funds on 135 markets, all from a single integrated account. Promoted
Valuation is complex, but we're here to simplify it.
Discover if National Bank of Canada might be undervalued or overvalued with our detailed analysis, featuring fair value estimates, potential risks, dividends, insider trades, and its financial condition.
Access Free AnalysisThis article by Simply Wall St is general in nature. It does not constitute a recommendation to buy or sell any stock, and does not take account of your objectives, or your financial situation. We aim to bring you long-term focused analysis driven by fundamental data. Note that our analysis may not factor in the latest price-sensitive company announcements or qualitative material. Simply Wall St has no position in any stocks mentioned.
*Interactive Brokers Rated Lowest Cost Broker by StockBrokers.com Annual Online Review 2020
Have feedback on this article? Concerned about the content? Get in touch with us directly. Alternatively, email editorial-team@simplywallst.com.
About TSX:NA
National Bank of Canada
Provides financial services to individuals, businesses, institutional clients, and governments in Canada and internationally.
Solid track record with excellent balance sheet and pays a dividend.
Market Insights

Community Narratives

