- Brazil
- /
- Healthcare Services
- /
- BOVESPA:VVEO3
Capital Allocation Trends At CM Hospitalar S/A (BVMF:VVEO3) Aren't Ideal


If we want to find a potential multi-bagger, often there are underlying trends that can provide clues. Firstly, we'll want to see a proven return on capital employed (ROCE) that is increasing, and secondly, an expanding base of capital employed. Put simply, these types of businesses are compounding machines, meaning they are continually reinvesting their earnings at ever-higher rates of return. Having said that, from a first glance at CM Hospitalar S/A (BVMF:VVEO3) we aren't jumping out of our chairs at how returns are trending, but let's have a deeper look.
Return On Capital Employed (ROCE): What Is It?
If you haven't worked with ROCE before, it measures the 'return' (pre-tax profit) a company generates from capital employed in its business. Analysts use this formula to calculate it for CM Hospitalar S/A:
Return on Capital Employed = Earnings Before Interest and Tax (EBIT) ÷ (Total Assets - Current Liabilities)
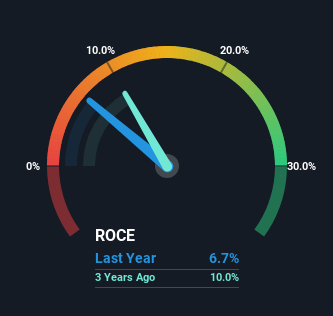
0.067 = R$544m ÷ (R$11b - R$3.0b) (Based on the trailing twelve months to March 2024).
Therefore, CM Hospitalar S/A has an ROCE of 6.7%. In absolute terms, that's a low return and it also under-performs the Healthcare industry average of 10%.
Check out our latest analysis for CM Hospitalar S/A
In the above chart we have measured CM Hospitalar S/A's prior ROCE against its prior performance, but the future is arguably more important. If you'd like to see what analysts are forecasting going forward, you should check out our free analyst report for CM Hospitalar S/A .
So How Is CM Hospitalar S/A's ROCE Trending?
On the surface, the trend of ROCE at CM Hospitalar S/A doesn't inspire confidence. Around five years ago the returns on capital were 8.9%, but since then they've fallen to 6.7%. Although, given both revenue and the amount of assets employed in the business have increased, it could suggest the company is investing in growth, and the extra capital has led to a short-term reduction in ROCE. And if the increased capital generates additional returns, the business, and thus shareholders, will benefit in the long run.
On a side note, CM Hospitalar S/A has done well to pay down its current liabilities to 27% of total assets. That could partly explain why the ROCE has dropped. Effectively this means their suppliers or short-term creditors are funding less of the business, which reduces some elements of risk. Since the business is basically funding more of its operations with it's own money, you could argue this has made the business less efficient at generating ROCE.
What We Can Learn From CM Hospitalar S/A's ROCE
Even though returns on capital have fallen in the short term, we find it promising that revenue and capital employed have both increased for CM Hospitalar S/A. But since the stock has dived 89% in the last year, there could be other drivers that are influencing the business' outlook. Regardless, reinvestment can pay off in the long run, so we think astute investors may want to look further into this stock.
On a final note, we found 5 warning signs for CM Hospitalar S/A (3 can't be ignored) you should be aware of.
While CM Hospitalar S/A isn't earning the highest return, check out this free list of companies that are earning high returns on equity with solid balance sheets.
New: AI Stock Screener & Alerts
Our new AI Stock Screener scans the market every day to uncover opportunities.
• Dividend Powerhouses (3%+ Yield)
• Undervalued Small Caps with Insider Buying
• High growth Tech and AI Companies
Or build your own from over 50 metrics.
Have feedback on this article? Concerned about the content? Get in touch with us directly. Alternatively, email editorial-team (at) simplywallst.com.
This article by Simply Wall St is general in nature. We provide commentary based on historical data and analyst forecasts only using an unbiased methodology and our articles are not intended to be financial advice. It does not constitute a recommendation to buy or sell any stock, and does not take account of your objectives, or your financial situation. We aim to bring you long-term focused analysis driven by fundamental data. Note that our analysis may not factor in the latest price-sensitive company announcements or qualitative material. Simply Wall St has no position in any stocks mentioned.
Have feedback on this article? Concerned about the content? Get in touch with us directly. Alternatively, email editorial-team@simplywallst.com
About BOVESPA:VVEO3
CM Hospitalar S/A
Engages in the distribution of hospital materials, medicines, and nutrition products in Brazil.
Undervalued with moderate growth potential.

