- Brazil
- /
- Healthcare Services
- /
- BOVESPA:FLRY3
Fleury (BVMF:FLRY3) earnings and shareholder returns have been trending downwards for the last five years, but the stock advances 8.9% this past week


Fleury S.A. (BVMF:FLRY3) shareholders should be happy to see the share price up 12% in the last month. But if you look at the last five years the returns have not been good. In fact, the share price is down 40%, which falls well short of the return you could get by buying an index fund.
While the stock has risen 8.9% in the past week but long term shareholders are still in the red, let's see what the fundamentals can tell us.
See our latest analysis for Fleury
There is no denying that markets are sometimes efficient, but prices do not always reflect underlying business performance. By comparing earnings per share (EPS) and share price changes over time, we can get a feel for how investor attitudes to a company have morphed over time.
Looking back five years, both Fleury's share price and EPS declined; the latter at a rate of 5.7% per year. Readers should note that the share price has fallen faster than the EPS, at a rate of 10% per year, over the period. So it seems the market was too confident about the business, in the past.
You can see how EPS has changed over time in the image below (click on the chart to see the exact values).
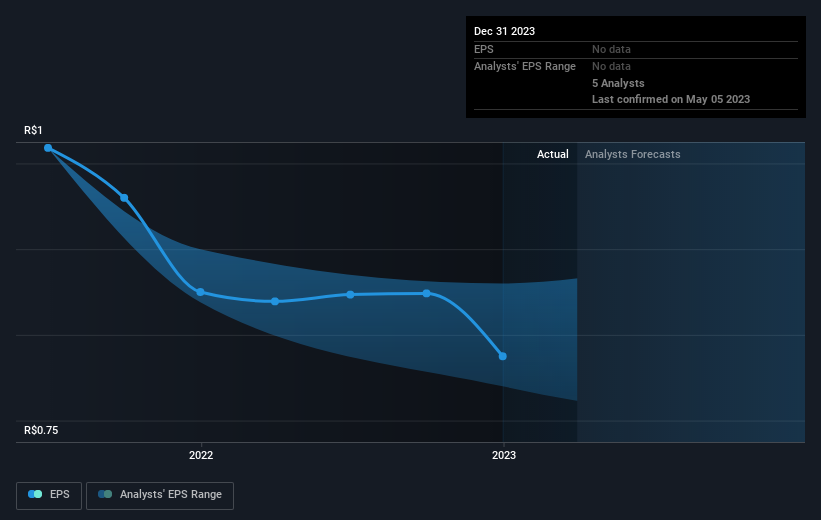
It might be well worthwhile taking a look at our free report on Fleury's earnings, revenue and cash flow.
What About Dividends?
When looking at investment returns, it is important to consider the difference between total shareholder return (TSR) and share price return. The TSR incorporates the value of any spin-offs or discounted capital raisings, along with any dividends, based on the assumption that the dividends are reinvested. It's fair to say that the TSR gives a more complete picture for stocks that pay a dividend. In the case of Fleury, it has a TSR of -28% for the last 5 years. That exceeds its share price return that we previously mentioned. The dividends paid by the company have thusly boosted the total shareholder return.
A Different Perspective
It's nice to see that Fleury shareholders have received a total shareholder return of 17% over the last year. Of course, that includes the dividend. Notably the five-year annualised TSR loss of 5% per year compares very unfavourably with the recent share price performance. We generally put more weight on the long term performance over the short term, but the recent improvement could hint at a (positive) inflection point within the business. While it is well worth considering the different impacts that market conditions can have on the share price, there are other factors that are even more important. Even so, be aware that Fleury is showing 3 warning signs in our investment analysis , and 1 of those makes us a bit uncomfortable...
Of course, you might find a fantastic investment by looking elsewhere. So take a peek at this free list of companies we expect will grow earnings.
Please note, the market returns quoted in this article reflect the market weighted average returns of stocks that currently trade on Brazilian exchanges.
If you're looking to trade Fleury, open an account with the lowest-cost platform trusted by professionals, Interactive Brokers.
With clients in over 200 countries and territories, and access to 160 markets, IBKR lets you trade stocks, options, futures, forex, bonds and funds from a single integrated account.
Enjoy no hidden fees, no account minimums, and FX conversion rates as low as 0.03%, far better than what most brokers offer.
Sponsored ContentNew: AI Stock Screener & Alerts
Our new AI Stock Screener scans the market every day to uncover opportunities.
• Dividend Powerhouses (3%+ Yield)
• Undervalued Small Caps with Insider Buying
• High growth Tech and AI Companies
Or build your own from over 50 metrics.
Have feedback on this article? Concerned about the content? Get in touch with us directly. Alternatively, email editorial-team (at) simplywallst.com.
This article by Simply Wall St is general in nature. We provide commentary based on historical data and analyst forecasts only using an unbiased methodology and our articles are not intended to be financial advice. It does not constitute a recommendation to buy or sell any stock, and does not take account of your objectives, or your financial situation. We aim to bring you long-term focused analysis driven by fundamental data. Note that our analysis may not factor in the latest price-sensitive company announcements or qualitative material. Simply Wall St has no position in any stocks mentioned.
About BOVESPA:FLRY3
Fleury
Provides medical services in the diagnostic, treatment, clinical analysis, health management, medical care, orthopedics, and ophthalmology areas in Brazil.
Undervalued with solid track record.
Similar Companies
Market Insights

Community Narratives

