JBS (BVMF:JBSS3) shareholders have earned a 81% return over the last year


Passive investing in index funds can generate returns that roughly match the overall market. But you can significantly boost your returns by picking above-average stocks. To wit, the JBS S.A. (BVMF:JBSS3) share price is 72% higher than it was a year ago, much better than the market return of around 7.1% (not including dividends) in the same period. So that should have shareholders smiling. In contrast, the longer term returns are negative, since the share price is 14% lower than it was three years ago.
Let's take a look at the underlying fundamentals over the longer term, and see if they've been consistent with shareholders returns.
View our latest analysis for JBS
There is no denying that markets are sometimes efficient, but prices do not always reflect underlying business performance. One way to examine how market sentiment has changed over time is to look at the interaction between a company's share price and its earnings per share (EPS).
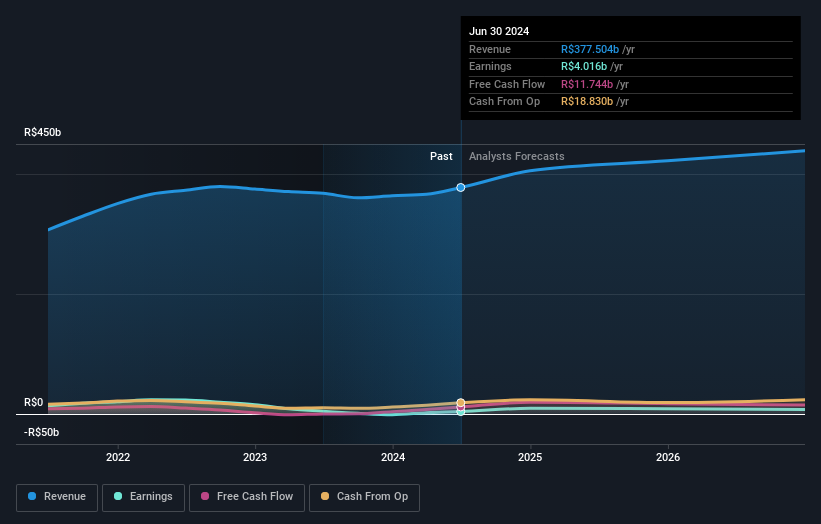
During the last year JBS grew its earnings per share, moving from a loss to a profit.
When a company has just transitioned to profitability, earnings per share growth is not always the best way to look at the share price action.
We haven't seen JBS increase dividend payments yet, so the yield probably hasn't helped drive the share higher. And at a glance the revenue growth does not impress, though a closer look at revenue trends may reveal some form of insight.
The graphic below depicts how earnings and revenue have changed over time (unveil the exact values by clicking on the image).
JBS is a well known stock, with plenty of analyst coverage, suggesting some visibility into future growth. So it makes a lot of sense to check out what analysts think JBS will earn in the future (free analyst consensus estimates)
What About Dividends?
When looking at investment returns, it is important to consider the difference between total shareholder return (TSR) and share price return. The TSR incorporates the value of any spin-offs or discounted capital raisings, along with any dividends, based on the assumption that the dividends are reinvested. So for companies that pay a generous dividend, the TSR is often a lot higher than the share price return. As it happens, JBS' TSR for the last 1 year was 81%, which exceeds the share price return mentioned earlier. The dividends paid by the company have thusly boosted the total shareholder return.
A Different Perspective
It's nice to see that JBS shareholders have received a total shareholder return of 81% over the last year. That's including the dividend. That's better than the annualised return of 8% over half a decade, implying that the company is doing better recently. In the best case scenario, this may hint at some real business momentum, implying that now could be a great time to delve deeper. While it is well worth considering the different impacts that market conditions can have on the share price, there are other factors that are even more important. To that end, you should learn about the 2 warning signs we've spotted with JBS (including 1 which is potentially serious) .
We will like JBS better if we see some big insider buys. While we wait, check out this free list of undervalued stocks (mostly small caps) with considerable, recent, insider buying.
Please note, the market returns quoted in this article reflect the market weighted average returns of stocks that currently trade on Brazilian exchanges.
New: Manage All Your Stock Portfolios in One Place
We've created the ultimate portfolio companion for stock investors, and it's free.
• Connect an unlimited number of Portfolios and see your total in one currency
• Be alerted to new Warning Signs or Risks via email or mobile
• Track the Fair Value of your stocks
Have feedback on this article? Concerned about the content? Get in touch with us directly. Alternatively, email editorial-team (at) simplywallst.com.
This article by Simply Wall St is general in nature. We provide commentary based on historical data and analyst forecasts only using an unbiased methodology and our articles are not intended to be financial advice. It does not constitute a recommendation to buy or sell any stock, and does not take account of your objectives, or your financial situation. We aim to bring you long-term focused analysis driven by fundamental data. Note that our analysis may not factor in the latest price-sensitive company announcements or qualitative material. Simply Wall St has no position in any stocks mentioned.
About BOVESPA:JBSS3
Solid track record and good value.

