Cambuci S.A.'s (BVMF:CAMB3) Fundamentals Look Pretty Strong: Could The Market Be Wrong About The Stock?


With its stock down 10% over the past week, it is easy to disregard Cambuci (BVMF:CAMB3). However, a closer look at its sound financials might cause you to think again. Given that fundamentals usually drive long-term market outcomes, the company is worth looking at. Particularly, we will be paying attention to Cambuci's ROE today.
Return on equity or ROE is an important factor to be considered by a shareholder because it tells them how effectively their capital is being reinvested. In simpler terms, it measures the profitability of a company in relation to shareholder's equity.
See our latest analysis for Cambuci
How Do You Calculate Return On Equity?
ROE can be calculated by using the formula:
Return on Equity = Net Profit (from continuing operations) ÷ Shareholders' Equity
So, based on the above formula, the ROE for Cambuci is:
26% = R$75m ÷ R$283m (Based on the trailing twelve months to September 2024).
The 'return' is the profit over the last twelve months. That means that for every R$1 worth of shareholders' equity, the company generated R$0.26 in profit.
What Has ROE Got To Do With Earnings Growth?
Thus far, we have learned that ROE measures how efficiently a company is generating its profits. We now need to evaluate how much profit the company reinvests or "retains" for future growth which then gives us an idea about the growth potential of the company. Assuming all else is equal, companies that have both a higher return on equity and higher profit retention are usually the ones that have a higher growth rate when compared to companies that don't have the same features.
A Side By Side comparison of Cambuci's Earnings Growth And 26% ROE
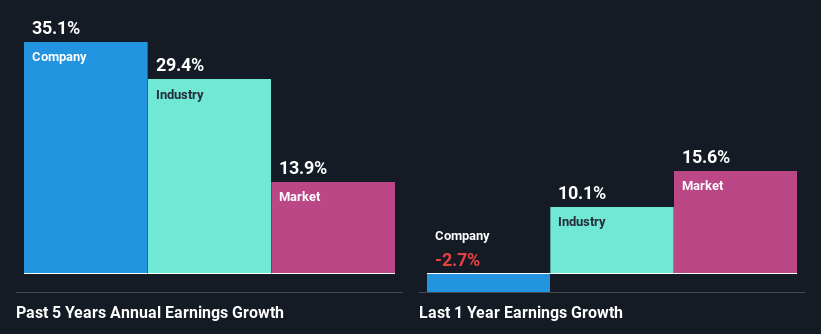
To start with, Cambuci's ROE looks acceptable. Especially when compared to the industry average of 17% the company's ROE looks pretty impressive. This certainly adds some context to Cambuci's exceptional 35% net income growth seen over the past five years. However, there could also be other causes behind this growth. Such as - high earnings retention or an efficient management in place.
As a next step, we compared Cambuci's net income growth with the industry and found that the company has a similar growth figure when compared with the industry average growth rate of 29% in the same period.
Earnings growth is a huge factor in stock valuation. It’s important for an investor to know whether the market has priced in the company's expected earnings growth (or decline). By doing so, they will have an idea if the stock is headed into clear blue waters or if swampy waters await. One good indicator of expected earnings growth is the P/E ratio which determines the price the market is willing to pay for a stock based on its earnings prospects. So, you may want to check if Cambuci is trading on a high P/E or a low P/E, relative to its industry.
Is Cambuci Efficiently Re-investing Its Profits?
Cambuci's ' three-year median payout ratio is on the lower side at 14% implying that it is retaining a higher percentage (86%) of its profits. So it looks like Cambuci is reinvesting profits heavily to grow its business, which shows in its earnings growth.
Moreover, Cambuci is determined to keep sharing its profits with shareholders which we infer from its long history of three years of paying a dividend.
Summary
In total, we are pretty happy with Cambuci's performance. Particularly, we like that the company is reinvesting heavily into its business, and at a high rate of return. Unsurprisingly, this has led to an impressive earnings growth. If the company continues to grow its earnings the way it has, that could have a positive impact on its share price given how earnings per share influence long-term share prices. Remember, the price of a stock is also dependent on the perceived risk. Therefore investors must keep themselves informed about the risks involved before investing in any company. Our risks dashboard will have the 1 risk we have identified for Cambuci.
New: AI Stock Screener & Alerts
Our new AI Stock Screener scans the market every day to uncover opportunities.
• Dividend Powerhouses (3%+ Yield)
• Undervalued Small Caps with Insider Buying
• High growth Tech and AI Companies
Or build your own from over 50 metrics.
Have feedback on this article? Concerned about the content? Get in touch with us directly. Alternatively, email editorial-team (at) simplywallst.com.
This article by Simply Wall St is general in nature. We provide commentary based on historical data and analyst forecasts only using an unbiased methodology and our articles are not intended to be financial advice. It does not constitute a recommendation to buy or sell any stock, and does not take account of your objectives, or your financial situation. We aim to bring you long-term focused analysis driven by fundamental data. Note that our analysis may not factor in the latest price-sensitive company announcements or qualitative material. Simply Wall St has no position in any stocks mentioned.
About BOVESPA:CAMB3
Flawless balance sheet and good value.
Market Insights

Community Narratives


