- Brazil
- /
- Professional Services
- /
- BOVESPA:IFCM3
Infracommerce CXaaS S.A. (BVMF:IFCM3) Stock Rockets 26% But Many Are Still Ignoring The Company
Those holding Infracommerce CXaaS S.A. (BVMF:IFCM3) shares would be relieved that the share price has rebounded 26% in the last thirty days, but it needs to keep going to repair the recent damage it has caused to investor portfolios. Still, the 30-day jump doesn't change the fact that longer term shareholders have seen their stock decimated by the 62% share price drop in the last twelve months.
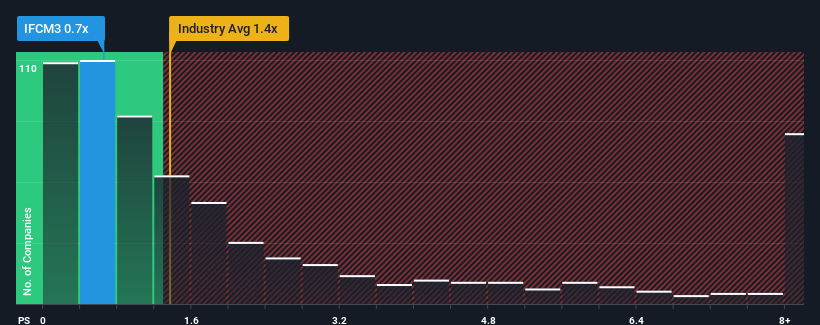
Although its price has surged higher, Infracommerce CXaaS may still be sending buy signals at present with its price-to-sales (or "P/S") ratio of 0.7x, considering almost half of all companies in the Professional Services industry in Brazil have P/S ratios greater than 1.4x and even P/S higher than 4x aren't out of the ordinary. Although, it's not wise to just take the P/S at face value as there may be an explanation why it's limited.
Check out our latest analysis for Infracommerce CXaaS

How Infracommerce CXaaS Has Been Performing
Infracommerce CXaaS certainly has been doing a good job lately as it's been growing revenue more than most other companies. Perhaps the market is expecting future revenue performance to dive, which has kept the P/S suppressed. If you like the company, you'd be hoping this isn't the case so that you could potentially pick up some stock while it's out of favour.
Want the full picture on analyst estimates for the company? Then our free report on Infracommerce CXaaS will help you uncover what's on the horizon.How Is Infracommerce CXaaS' Revenue Growth Trending?
Infracommerce CXaaS' P/S ratio would be typical for a company that's only expected to deliver limited growth, and importantly, perform worse than the industry.
If we review the last year of revenue growth, the company posted a terrific increase of 34%. Spectacularly, three year revenue growth has ballooned by several orders of magnitude, thanks in part to the last 12 months of revenue growth. So we can start by confirming that the company has done a tremendous job of growing revenue over that time.
Shifting to the future, estimates from the four analysts covering the company suggest revenue should grow by 16% per year over the next three years. That's shaping up to be materially higher than the 7.0% per year growth forecast for the broader industry.
With this information, we find it odd that Infracommerce CXaaS is trading at a P/S lower than the industry. It looks like most investors are not convinced at all that the company can achieve future growth expectations.
The Key Takeaway
Despite Infracommerce CXaaS' share price climbing recently, its P/S still lags most other companies. It's argued the price-to-sales ratio is an inferior measure of value within certain industries, but it can be a powerful business sentiment indicator.
Infracommerce CXaaS' analyst forecasts revealed that its superior revenue outlook isn't contributing to its P/S anywhere near as much as we would have predicted. There could be some major risk factors that are placing downward pressure on the P/S ratio. It appears the market could be anticipating revenue instability, because these conditions should normally provide a boost to the share price.
And what about other risks? Every company has them, and we've spotted 3 warning signs for Infracommerce CXaaS (of which 1 is a bit unpleasant!) you should know about.
It's important to make sure you look for a great company, not just the first idea you come across. So if growing profitability aligns with your idea of a great company, take a peek at this free list of interesting companies with strong recent earnings growth (and a low P/E).
New: AI Stock Screener & Alerts
Our new AI Stock Screener scans the market every day to uncover opportunities.
• Dividend Powerhouses (3%+ Yield)
• Undervalued Small Caps with Insider Buying
• High growth Tech and AI Companies
Or build your own from over 50 metrics.
Have feedback on this article? Concerned about the content? Get in touch with us directly. Alternatively, email editorial-team (at) simplywallst.com.
This article by Simply Wall St is general in nature. We provide commentary based on historical data and analyst forecasts only using an unbiased methodology and our articles are not intended to be financial advice. It does not constitute a recommendation to buy or sell any stock, and does not take account of your objectives, or your financial situation. We aim to bring you long-term focused analysis driven by fundamental data. Note that our analysis may not factor in the latest price-sensitive company announcements or qualitative material. Simply Wall St has no position in any stocks mentioned.
About BOVESPA:IFCM3
Infracommerce CXaaS
Provides digital solutions for various brands and industries in Brazil, Mexico, Colombia, Peru, Chile, Argentina, Uruguay, and Latin America.
Medium-low risk and undervalued.
Market Insights
Community Narratives


