
Advertisement

There are a few key trends to look for if we want to identify the next multi-bagger. In a perfect world, we'd like to see a company investing more capital into its business and ideally the returns earned from that capital are also increasing. This shows us that it's a compounding machine, able to continually reinvest its earnings back into the business and generate higher returns. So, when we ran our eye over Trace Group Hold's (BUL:T57) trend of ROCE, we liked what we saw.
Return On Capital Employed (ROCE): What Is It?
Just to clarify if you're unsure, ROCE is a metric for evaluating how much pre-tax income (in percentage terms) a company earns on the capital invested in its business. Analysts use this formula to calculate it for Trace Group Hold:
Return on Capital Employed = Earnings Before Interest and Tax (EBIT) ÷ (Total Assets - Current Liabilities)
0.14 = лв26m ÷ (лв601m - лв408m) (Based on the trailing twelve months to December 2024).
So, Trace Group Hold has an ROCE of 14%. In absolute terms, that's a satisfactory return, but compared to the Construction industry average of 11% it's much better.
Check out our latest analysis for Trace Group Hold
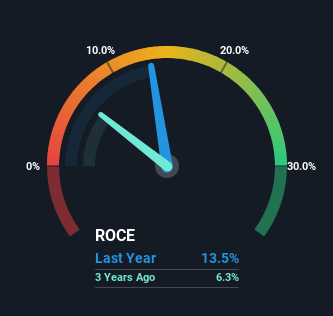
Historical performance is a great place to start when researching a stock so above you can see the gauge for Trace Group Hold's ROCE against it's prior returns. If you'd like to look at how Trace Group Hold has performed in the past in other metrics, you can view this free graph of Trace Group Hold's past earnings, revenue and cash flow .
So How Is Trace Group Hold's ROCE Trending?
The trend of ROCE doesn't stand out much, but returns on a whole are decent. The company has consistently earned 14% for the last five years, and the capital employed within the business has risen 43% in that time. 14% is a pretty standard return, and it provides some comfort knowing that Trace Group Hold has consistently earned this amount. Stable returns in this ballpark can be unexciting, but if they can be maintained over the long run, they often provide nice rewards to shareholders.
Another point to note, we noticed the company has increased current liabilities over the last five years. This is intriguing because if current liabilities hadn't increased to 68% of total assets, this reported ROCE would probably be less than14% because total capital employed would be higher.The 14% ROCE could be even lower if current liabilities weren't 68% of total assets, because the the formula would show a larger base of total capital employed. So with current liabilities at such high levels, this effectively means the likes of suppliers or short-term creditors are funding a meaningful part of the business, which in some instances can bring some risks.
The Bottom Line On Trace Group Hold's ROCE
The main thing to remember is that Trace Group Hold has proven its ability to continually reinvest at respectable rates of return. And long term investors would be thrilled with the 115% return they've received over the last five years. So even though the stock might be more "expensive" than it was before, we think the strong fundamentals warrant this stock for further research.
One final note, you should learn about the 5 warning signs we've spotted with Trace Group Hold (including 3 which can't be ignored) .
While Trace Group Hold may not currently earn the highest returns, we've compiled a list of companies that currently earn more than 25% return on equity. Check out this free list here.
Valuation is complex, but we're here to simplify it.
Discover if Trace Group Hold might be undervalued or overvalued with our detailed analysis, featuring fair value estimates, potential risks, dividends, insider trades, and its financial condition.
Access Free AnalysisHave feedback on this article? Concerned about the content? Get in touch with us directly. Alternatively, email editorial-team (at) simplywallst.com.
This article by Simply Wall St is general in nature. We provide commentary based on historical data and analyst forecasts only using an unbiased methodology and our articles are not intended to be financial advice. It does not constitute a recommendation to buy or sell any stock, and does not take account of your objectives, or your financial situation. We aim to bring you long-term focused analysis driven by fundamental data. Note that our analysis may not factor in the latest price-sensitive company announcements or qualitative material. Simply Wall St has no position in any stocks mentioned.
About BUL:T57
Trace Group Hold
Through its subsidiaries, provides construction services for road infrastructure projects in Bulgaria and internationally.
Proven track record slight.
Market Insights

Advertisement
Community Narratives
Pinterest will surge as advertising innovations ignite revenue growth
Fair Value US$42.63|27.0% undervalued
BR
Community Contributor
Brambles' Revenue Set to Climb 14% with Profit Margins Following
Fair Value AU$21.90|5.9% overvalued
RO
Community Contributor
Challenging Future for STG as Organic Sales Decline by 8.8%
Fair Value DKK 116.13|26.8% undervalued
KA
Community Contributor