- Bulgaria
- /
- Electrical
- /
- BUL:ELHM
Elhim Iskra AD (BUL:ELHM) Held Back By Insufficient Growth Even After Shares Climb 34%


Elhim Iskra AD (BUL:ELHM) shareholders would be excited to see that the share price has had a great month, posting a 34% gain and recovering from prior weakness. Not all shareholders will be feeling jubilant, since the share price is still down a very disappointing 12% in the last twelve months.
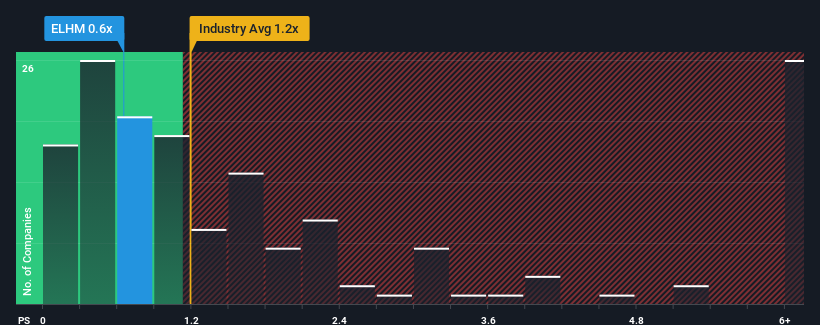
In spite of the firm bounce in price, Elhim Iskra AD's price-to-sales (or "P/S") ratio of 0.6x might still make it look like a buy right now compared to the Electrical industry in Bulgaria, where around half of the companies have P/S ratios above 1.2x and even P/S above 4x are quite common. Although, it's not wise to just take the P/S at face value as there may be an explanation why it's limited.
View our latest analysis for Elhim Iskra AD
What Does Elhim Iskra AD's P/S Mean For Shareholders?
For example, consider that Elhim Iskra AD's financial performance has been poor lately as its revenue has been in decline. One possibility is that the P/S is low because investors think the company won't do enough to avoid underperforming the broader industry in the near future. Those who are bullish on Elhim Iskra AD will be hoping that this isn't the case so that they can pick up the stock at a lower valuation.
Although there are no analyst estimates available for Elhim Iskra AD, take a look at this free data-rich visualisation to see how the company stacks up on earnings, revenue and cash flow.Do Revenue Forecasts Match The Low P/S Ratio?
There's an inherent assumption that a company should underperform the industry for P/S ratios like Elhim Iskra AD's to be considered reasonable.
Retrospectively, the last year delivered a frustrating 22% decrease to the company's top line. This has soured the latest three-year period, which nevertheless managed to deliver a decent 26% overall rise in revenue. Although it's been a bumpy ride, it's still fair to say the revenue growth recently has been mostly respectable for the company.
Comparing the recent medium-term revenue trends against the industry's one-year growth forecast of 11% shows it's noticeably less attractive.
With this information, we can see why Elhim Iskra AD is trading at a P/S lower than the industry. It seems most investors are expecting to see the recent limited growth rates continue into the future and are only willing to pay a reduced amount for the stock.
What Does Elhim Iskra AD's P/S Mean For Investors?
Elhim Iskra AD's stock price has surged recently, but its but its P/S still remains modest. While the price-to-sales ratio shouldn't be the defining factor in whether you buy a stock or not, it's quite a capable barometer of revenue expectations.
As we suspected, our examination of Elhim Iskra AD revealed its three-year revenue trends are contributing to its low P/S, given they look worse than current industry expectations. Right now shareholders are accepting the low P/S as they concede future revenue probably won't provide any pleasant surprises. Unless the recent medium-term conditions improve, they will continue to form a barrier for the share price around these levels.
Before you settle on your opinion, we've discovered 3 warning signs for Elhim Iskra AD (2 are significant!) that you should be aware of.
It's important to make sure you look for a great company, not just the first idea you come across. So if growing profitability aligns with your idea of a great company, take a peek at this free list of interesting companies with strong recent earnings growth (and a low P/E).
Valuation is complex, but we're here to simplify it.
Discover if Elhim Iskra AD might be undervalued or overvalued with our detailed analysis, featuring fair value estimates, potential risks, dividends, insider trades, and its financial condition.
Access Free AnalysisHave feedback on this article? Concerned about the content? Get in touch with us directly. Alternatively, email editorial-team (at) simplywallst.com.
This article by Simply Wall St is general in nature. We provide commentary based on historical data and analyst forecasts only using an unbiased methodology and our articles are not intended to be financial advice. It does not constitute a recommendation to buy or sell any stock, and does not take account of your objectives, or your financial situation. We aim to bring you long-term focused analysis driven by fundamental data. Note that our analysis may not factor in the latest price-sensitive company announcements or qualitative material. Simply Wall St has no position in any stocks mentioned.
About BUL:ELHM
Elhim Iskra AD
Manufactures and sells lead-acid starter and traction batteries in Bulgaria and internationally.
Flawless balance sheet low.

