Advertisement
- Belgium
- /
- Diversified Financial
- /
- ENXTBR:MONNI
Calculating The Fair Value Of Keyware Technologies NV (EBR:KEYW)
In this article we are going to estimate the intrinsic value of Keyware Technologies NV (EBR:KEYW) by estimating the company's future cash flows and discounting them to their present value. Our analysis will employ the Discounted Cash Flow (DCF) model. It may sound complicated, but actually it is quite simple!
Companies can be valued in a lot of ways, so we would point out that a DCF is not perfect for every situation. If you still have some burning questions about this type of valuation, take a look at the Simply Wall St analysis model.
View our latest analysis for Keyware Technologies
What's the estimated valuation?
We're using the 2-stage growth model, which simply means we take in account two stages of company's growth. In the initial period the company may have a higher growth rate and the second stage is usually assumed to have a stable growth rate. In the first stage we need to estimate the cash flows to the business over the next ten years. Seeing as no analyst estimates of free cash flow are available to us, we have extrapolate the previous free cash flow (FCF) from the company's last reported value. We assume companies with shrinking free cash flow will slow their rate of shrinkage, and that companies with growing free cash flow will see their growth rate slow, over this period. We do this to reflect that growth tends to slow more in the early years than it does in later years.
Generally we assume that a dollar today is more valuable than a dollar in the future, and so the sum of these future cash flows is then discounted to today's value:
10-year free cash flow (FCF) estimate
| 2021 | 2022 | 2023 | 2024 | 2025 | 2026 | 2027 | 2028 | 2029 | 2030 | |
| Levered FCF (€, Millions) | €2.13m | €1.92m | €1.80m | €1.72m | €1.68m | €1.66m | €1.65m | €1.65m | €1.66m | €1.67m |
| Growth Rate Estimate Source | Est @ -14.48% | Est @ -9.72% | Est @ -6.39% | Est @ -4.06% | Est @ -2.43% | Est @ -1.29% | Est @ -0.49% | Est @ 0.07% | Est @ 0.47% | Est @ 0.74% |
| Present Value (€, Millions) Discounted @ 8.6% | €2.0 | €1.6 | €1.4 | €1.2 | €1.1 | €1.0 | €0.9 | €0.9 | €0.8 | €0.7 |
("Est" = FCF growth rate estimated by Simply Wall St)
Present Value of 10-year Cash Flow (PVCF) = €11m
The second stage is also known as Terminal Value, this is the business's cash flow after the first stage. For a number of reasons a very conservative growth rate is used that cannot exceed that of a country's GDP growth. In this case we have used the 5-year average of the 10-year government bond yield (1.4%) to estimate future growth. In the same way as with the 10-year 'growth' period, we discount future cash flows to today's value, using a cost of equity of 8.6%.
Terminal Value (TV)= FCF2030 × (1 + g) ÷ (r – g) = €1.7m× (1 + 1.4%) ÷ (8.6%– 1.4%) = €23m
Present Value of Terminal Value (PVTV)= TV / (1 + r)10= €23m÷ ( 1 + 8.6%)10= €10m
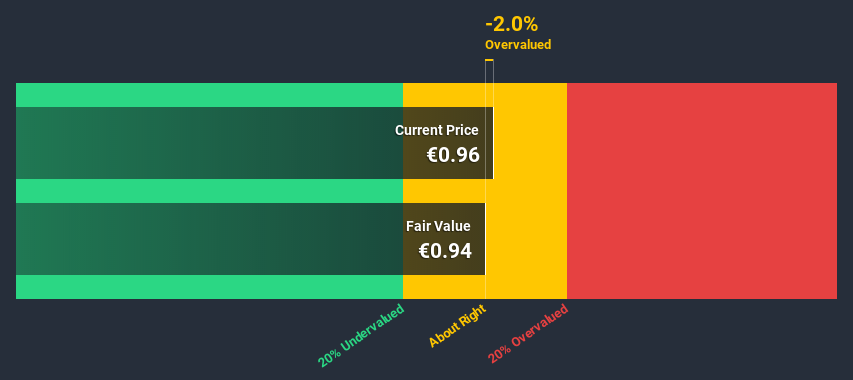
The total value, or equity value, is then the sum of the present value of the future cash flows, which in this case is €21m. In the final step we divide the equity value by the number of shares outstanding. Compared to the current share price of €1.0, the company appears around fair value at the time of writing. The assumptions in any calculation have a big impact on the valuation, so it is better to view this as a rough estimate, not precise down to the last cent.
Important assumptions
Now the most important inputs to a discounted cash flow are the discount rate, and of course, the actual cash flows. If you don't agree with these result, have a go at the calculation yourself and play with the assumptions. The DCF also does not consider the possible cyclicality of an industry, or a company's future capital requirements, so it does not give a full picture of a company's potential performance. Given that we are looking at Keyware Technologies as potential shareholders, the cost of equity is used as the discount rate, rather than the cost of capital (or weighted average cost of capital, WACC) which accounts for debt. In this calculation we've used 8.6%, which is based on a levered beta of 1.186. Beta is a measure of a stock's volatility, compared to the market as a whole. We get our beta from the industry average beta of globally comparable companies, with an imposed limit between 0.8 and 2.0, which is a reasonable range for a stable business.
Looking Ahead:
Whilst important, the DCF calculation shouldn't be the only metric you look at when researching a company. The DCF model is not a perfect stock valuation tool. Rather it should be seen as a guide to "what assumptions need to be true for this stock to be under/overvalued?" If a company grows at a different rate, or if its cost of equity or risk free rate changes sharply, the output can look very different. For Keyware Technologies, we've put together three pertinent factors you should further research:
- Risks: Case in point, we've spotted 5 warning signs for Keyware Technologies you should be aware of, and 1 of them shouldn't be ignored.
- Other Solid Businesses: Low debt, high returns on equity and good past performance are fundamental to a strong business. Why not explore our interactive list of stocks with solid business fundamentals to see if there are other companies you may not have considered!
- Other Top Analyst Picks: Interested to see what the analysts are thinking? Take a look at our interactive list of analysts' top stock picks to find out what they feel might have an attractive future outlook!
PS. Simply Wall St updates its DCF calculation for every Belgian stock every day, so if you want to find the intrinsic value of any other stock just search here.
If you decide to trade Keyware Technologies, use the lowest-cost* platform that is rated #1 Overall by Barron’s, Interactive Brokers. Trade stocks, options, futures, forex, bonds and funds on 135 markets, all from a single integrated account. Promoted
New: Manage All Your Stock Portfolios in One Place
We've created the ultimate portfolio companion for stock investors, and it's free.
• Connect an unlimited number of Portfolios and see your total in one currency
• Be alerted to new Warning Signs or Risks via email or mobile
• Track the Fair Value of your stocks
This article by Simply Wall St is general in nature. It does not constitute a recommendation to buy or sell any stock, and does not take account of your objectives, or your financial situation. We aim to bring you long-term focused analysis driven by fundamental data. Note that our analysis may not factor in the latest price-sensitive company announcements or qualitative material. Simply Wall St has no position in any stocks mentioned.
*Interactive Brokers Rated Lowest Cost Broker by StockBrokers.com Annual Online Review 2020
Have feedback on this article? Concerned about the content? Get in touch with us directly. Alternatively, email editorial-team (at) simplywallst.com.
About ENXTBR:MONNI
Monni
Provides electronic payment solutions in Belgium, France, and internationally.
Excellent balance sheet average dividend payer.
Similar Companies
Market Insights


Advertisement
Weekly Picks
CE


Ceazar on Sparc AI ·
When GPS fails: this small cap is fixing a $54B drone problem
Fair Value:CA$5.2540.0% undervalued
89 followersusers have followed this narrative
0 commentsusers have commented on this narrative
22 likesusers have liked this narrative
HE


HedgeY on IonQ ·
The Best-Funded Quantum Platform and Still a Stock Priced for Perfection
Fair Value:US$482.3% overvalued
33 followersusers have followed this narrative
0 commentsusers have commented on this narrative
9 likesusers have liked this narrative
BL


BlackGoat on Cerebras Systems ·
The Wafer Giant Threatening NVIDIA's GPU Hegemony
Fair Value:US$415.5450.7% undervalued
57 followersusers have followed this narrative
1 commentusers have commented on this narrative
10 likesusers have liked this narrative
IV

Ivoed on Netflix ·
Netflix’s Business Quality Is Clear. The Harder Question Is Whether The Stock Is Still Cheap
Fair Value:US$825.3% undervalued
28 followersusers have followed this narrative
2 commentsusers have commented on this narrative
10 likesusers have liked this narrative
Recently Updated Narratives
KE


Kentaiga on Microsoft ·
Microsoft Are Industry Leaders at a Heavy Discount
Fair Value:US$50021.9% undervalued
2 followersusers have followed this narrative
0 commentsusers have commented on this narrative
0 likesusers have liked this narrative
IV

Ivoed on SBM Offshore ·
Why SBM Offshore’s €30 Share Price May Be Too Harsh On Its Backlog
Fair Value:€44.529.7% undervalued
1 followerusers have followed this narrative
0 commentsusers have commented on this narrative
0 likesusers have liked this narrative
AN


AntonioS on Medibank Private ·
Medibank Private Limited. No Margin of Safety!
Fair Value:AU$3.830.8% overvalued
1 followerusers have followed this narrative
0 commentsusers have commented on this narrative
0 likesusers have liked this narrative
Popular Narratives
IN


Investingwilly on Mastercard ·
Mastercard: The Best Dividend Stock You're Ignoring
Fair Value:US$75028.1% undervalued
83 followersusers have followed this narrative
1 commentusers have commented on this narrative
9 likesusers have liked this narrative
HA


HarishPK on Adobe ·
Adobe: A Probabilistic Case for Undervaluation
Fair Value:US$319.9631.3% undervalued
64 followersusers have followed this narrative
9 commentsusers have commented on this narrative
19 likesusers have liked this narrative
NI

niteco on Broadcom ·
A Capital Allocation Favorite with Structural Importance
Fair Value:US$651.0544.6% undervalued
56 followersusers have followed this narrative
0 commentsusers have commented on this narrative
13 likesusers have liked this narrative
Trending Discussion


MW

mwod31 on Greatland Resources ·
A great comment, WSB have not done the research imo. I intend to buy more shares in 2026.
0
|0