

Some say volatility, rather than debt, is the best way to think about risk as an investor, but Warren Buffett famously said that 'Volatility is far from synonymous with risk.' So it might be obvious that you need to consider debt, when you think about how risky any given stock is, because too much debt can sink a company. Importantly, UCB SA (EBR:UCB) does carry debt. But is this debt a concern to shareholders?
When Is Debt A Problem?
Debt and other liabilities become risky for a business when it cannot easily fulfill those obligations, either with free cash flow or by raising capital at an attractive price. In the worst case scenario, a company can go bankrupt if it cannot pay its creditors. However, a more common (but still painful) scenario is that it has to raise new equity capital at a low price, thus permanently diluting shareholders. Of course, debt can be an important tool in businesses, particularly capital heavy businesses. When we think about a company's use of debt, we first look at cash and debt together.
See our latest analysis for UCB
What Is UCB's Debt?
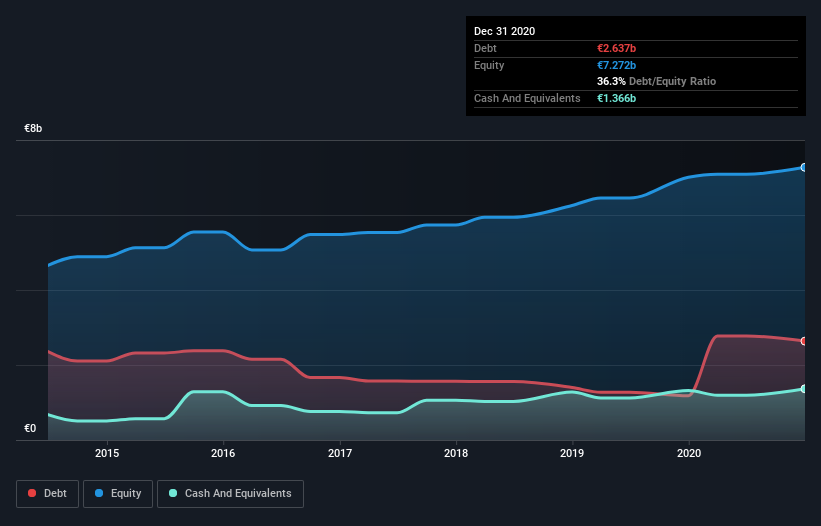
As you can see below, at the end of December 2020, UCB had €2.64b of debt, up from €1.18b a year ago. Click the image for more detail. However, it also had €1.37b in cash, and so its net debt is €1.27b.
How Strong Is UCB's Balance Sheet?
The latest balance sheet data shows that UCB had liabilities of €2.81b due within a year, and liabilities of €3.23b falling due after that. On the other hand, it had cash of €1.37b and €939.0m worth of receivables due within a year. So its liabilities total €3.74b more than the combination of its cash and short-term receivables.
While this might seem like a lot, it is not so bad since UCB has a huge market capitalization of €16.1b, and so it could probably strengthen its balance sheet by raising capital if it needed to. However, it is still worthwhile taking a close look at its ability to pay off debt.
We measure a company's debt load relative to its earnings power by looking at its net debt divided by its earnings before interest, tax, depreciation, and amortization (EBITDA) and by calculating how easily its earnings before interest and tax (EBIT) cover its interest expense (interest cover). The advantage of this approach is that we take into account both the absolute quantum of debt (with net debt to EBITDA) and the actual interest expenses associated with that debt (with its interest cover ratio).
UCB's net debt is only 0.91 times its EBITDA. And its EBIT covers its interest expense a whopping 20.3 times over. So you could argue it is no more threatened by its debt than an elephant is by a mouse. While UCB doesn't seem to have gained much on the EBIT line, at least earnings remain stable for now. The balance sheet is clearly the area to focus on when you are analysing debt. But it is future earnings, more than anything, that will determine UCB's ability to maintain a healthy balance sheet going forward. So if you want to see what the professionals think, you might find this free report on analyst profit forecasts to be interesting.
Finally, a company can only pay off debt with cold hard cash, not accounting profits. So we clearly need to look at whether that EBIT is leading to corresponding free cash flow. During the last three years, UCB produced sturdy free cash flow equating to 62% of its EBIT, about what we'd expect. This cold hard cash means it can reduce its debt when it wants to.
Our View
UCB's interest cover suggests it can handle its debt as easily as Cristiano Ronaldo could score a goal against an under 14's goalkeeper. And the good news does not stop there, as its net debt to EBITDA also supports that impression! Looking at all the aforementioned factors together, it strikes us that UCB can handle its debt fairly comfortably. On the plus side, this leverage can boost shareholder returns, but the potential downside is more risk of loss, so it's worth monitoring the balance sheet. Above most other metrics, we think its important to track how fast earnings per share is growing, if at all. If you've also come to that realization, you're in luck, because today you can view this interactive graph of UCB's earnings per share history for free.
At the end of the day, it's often better to focus on companies that are free from net debt. You can access our special list of such companies (all with a track record of profit growth). It's free.
If you decide to trade UCB, use the lowest-cost* platform that is rated #1 Overall by Barron’s, Interactive Brokers. Trade stocks, options, futures, forex, bonds and funds on 135 markets, all from a single integrated account. Promoted
If you're looking to trade UCB, open an account with the lowest-cost platform trusted by professionals, Interactive Brokers.
With clients in over 200 countries and territories, and access to 160 markets, IBKR lets you trade stocks, options, futures, forex, bonds and funds from a single integrated account.
Enjoy no hidden fees, no account minimums, and FX conversion rates as low as 0.03%, far better than what most brokers offer.
Sponsored ContentNew: AI Stock Screener & Alerts
Our new AI Stock Screener scans the market every day to uncover opportunities.
• Dividend Powerhouses (3%+ Yield)
• Undervalued Small Caps with Insider Buying
• High growth Tech and AI Companies
Or build your own from over 50 metrics.
This article by Simply Wall St is general in nature. It does not constitute a recommendation to buy or sell any stock, and does not take account of your objectives, or your financial situation. We aim to bring you long-term focused analysis driven by fundamental data. Note that our analysis may not factor in the latest price-sensitive company announcements or qualitative material. Simply Wall St has no position in any stocks mentioned.
*Interactive Brokers Rated Lowest Cost Broker by StockBrokers.com Annual Online Review 2020
Have feedback on this article? Concerned about the content? Get in touch with us directly. Alternatively, email editorial-team (at) simplywallst.com.
About ENXTBR:UCB
UCB
A biopharmaceutical company, develops products and solutions for people with neurology and immunology diseases worldwide.
Undervalued with excellent balance sheet.
Similar Companies
Market Insights

Community Narratives

