
Advertisement
Today we'll do a simple run through of a valuation method used to estimate the attractiveness of Greenyard NV (EBR:GREEN) as an investment opportunity by taking the expected future cash flows and discounting them to today's value. The Discounted Cash Flow (DCF) model is the tool we will apply to do this. Models like these may appear beyond the comprehension of a lay person, but they're fairly easy to follow.
Companies can be valued in a lot of ways, so we would point out that a DCF is not perfect for every situation. If you want to learn more about discounted cash flow, the rationale behind this calculation can be read in detail in the Simply Wall St analysis model.
View our latest analysis for Greenyard
What's the estimated valuation?
We are going to use a two-stage DCF model, which, as the name states, takes into account two stages of growth. The first stage is generally a higher growth period which levels off heading towards the terminal value, captured in the second 'steady growth' period. To begin with, we have to get estimates of the next ten years of cash flows. Where possible we use analyst estimates, but when these aren't available we extrapolate the previous free cash flow (FCF) from the last estimate or reported value. We assume companies with shrinking free cash flow will slow their rate of shrinkage, and that companies with growing free cash flow will see their growth rate slow, over this period. We do this to reflect that growth tends to slow more in the early years than it does in later years.
A DCF is all about the idea that a dollar in the future is less valuable than a dollar today, so we discount the value of these future cash flows to their estimated value in today's dollars:
10-year free cash flow (FCF) forecast
| 2021 | 2022 | 2023 | 2024 | 2025 | 2026 | 2027 | 2028 | 2029 | 2030 | |
| Levered FCF (€, Millions) | €50.6m | €58.3m | €68.1m | €57.0m | €50.7m | €47.0m | €44.8m | €43.5m | €42.8m | €42.5m |
| Growth Rate Estimate Source | Analyst x2 | Analyst x2 | Analyst x2 | Est @ -16.29% | Est @ -10.99% | Est @ -7.28% | Est @ -4.68% | Est @ -2.86% | Est @ -1.59% | Est @ -0.7% |
| Present Value (€, Millions) Discounted @ 9.8% | €46.0 | €48.3 | €51.3 | €39.1 | €31.7 | €26.8 | €23.2 | €20.5 | €18.4 | €16.6 |
("Est" = FCF growth rate estimated by Simply Wall St)
Present Value of 10-year Cash Flow (PVCF) = €322m
After calculating the present value of future cash flows in the initial 10-year period, we need to calculate the Terminal Value, which accounts for all future cash flows beyond the first stage. For a number of reasons a very conservative growth rate is used that cannot exceed that of a country's GDP growth. In this case we have used the 5-year average of the 10-year government bond yield (1.4%) to estimate future growth. In the same way as with the 10-year 'growth' period, we discount future cash flows to today's value, using a cost of equity of 9.8%.
Terminal Value (TV)= FCF2030 × (1 + g) ÷ (r – g) = €43m× (1 + 1.4%) ÷ (9.8%– 1.4%) = €510m
Present Value of Terminal Value (PVTV)= TV / (1 + r)10= €510m÷ ( 1 + 9.8%)10= €199m
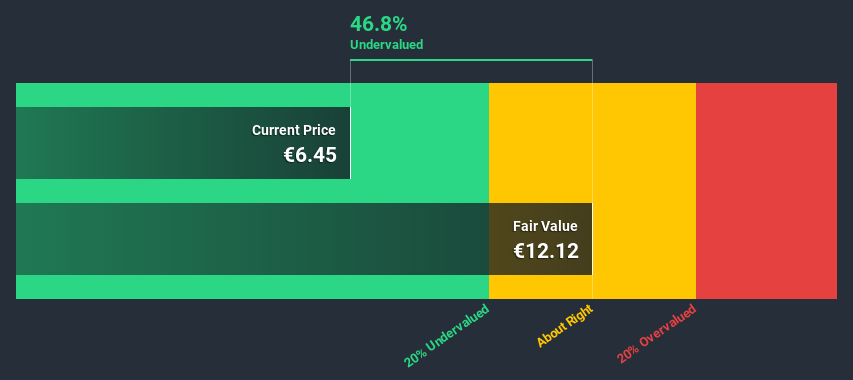
The total value, or equity value, is then the sum of the present value of the future cash flows, which in this case is €521m. In the final step we divide the equity value by the number of shares outstanding. Relative to the current share price of €6.5, the company appears quite undervalued at a 47% discount to where the stock price trades currently. The assumptions in any calculation have a big impact on the valuation, so it is better to view this as a rough estimate, not precise down to the last cent.
Important assumptions
We would point out that the most important inputs to a discounted cash flow are the discount rate and of course the actual cash flows. You don't have to agree with these inputs, I recommend redoing the calculations yourself and playing with them. The DCF also does not consider the possible cyclicality of an industry, or a company's future capital requirements, so it does not give a full picture of a company's potential performance. Given that we are looking at Greenyard as potential shareholders, the cost of equity is used as the discount rate, rather than the cost of capital (or weighted average cost of capital, WACC) which accounts for debt. In this calculation we've used 9.8%, which is based on a levered beta of 1.383. Beta is a measure of a stock's volatility, compared to the market as a whole. We get our beta from the industry average beta of globally comparable companies, with an imposed limit between 0.8 and 2.0, which is a reasonable range for a stable business.
Looking Ahead:
Valuation is only one side of the coin in terms of building your investment thesis, and it shouldn't be the only metric you look at when researching a company. DCF models are not the be-all and end-all of investment valuation. Rather it should be seen as a guide to "what assumptions need to be true for this stock to be under/overvalued?" For instance, if the terminal value growth rate is adjusted slightly, it can dramatically alter the overall result. Why is the intrinsic value higher than the current share price? For Greenyard, there are three relevant aspects you should further research:
- Risks: Take risks, for example - Greenyard has 1 warning sign we think you should be aware of.
- Future Earnings: How does GREEN's growth rate compare to its peers and the wider market? Dig deeper into the analyst consensus number for the upcoming years by interacting with our free analyst growth expectation chart.
- Other Solid Businesses: Low debt, high returns on equity and good past performance are fundamental to a strong business. Why not explore our interactive list of stocks with solid business fundamentals to see if there are other companies you may not have considered!
PS. The Simply Wall St app conducts a discounted cash flow valuation for every stock on the ENXTBR every day. If you want to find the calculation for other stocks just search here.
If you’re looking to trade Greenyard, open an account with the lowest-cost* platform trusted by professionals, Interactive Brokers. Their clients from over 200 countries and territories trade stocks, options, futures, forex, bonds and funds worldwide from a single integrated account. Promoted
New: Manage All Your Stock Portfolios in One Place
We've created the ultimate portfolio companion for stock investors, and it's free.
• Connect an unlimited number of Portfolios and see your total in one currency
• Be alerted to new Warning Signs or Risks via email or mobile
• Track the Fair Value of your stocks
This article by Simply Wall St is general in nature. It does not constitute a recommendation to buy or sell any stock, and does not take account of your objectives, or your financial situation. We aim to bring you long-term focused analysis driven by fundamental data. Note that our analysis may not factor in the latest price-sensitive company announcements or qualitative material. Simply Wall St has no position in any stocks mentioned.
*Interactive Brokers Rated Lowest Cost Broker by StockBrokers.com Annual Online Review 2020
Have feedback on this article? Concerned about the content? Get in touch with us directly. Alternatively, email editorial-team (at) simplywallst.com.
About ENXTBR:GREEN
Greenyard
Supplies fresh, frozen, prepared fruits and vegetables, flowers, and plants in Germany, the Netherlands, Belgium, the United Kingdom, France, rest of Europe, and internationally.
Undervalued with excellent balance sheet.
Similar Companies
Market Insights

Advertisement
Community Narratives
The Next Phase of Energy Storage: How NeoVolta Is Tackling America’s Power Crunch
Fair Value US$7.50|35.1% undervalued
MA
Community Contributor
Why EnSilica is Worth Possibly 13x its Current Price
Fair Value UK£5.00|89.8% undervalued
DO
Community Contributor
M&A Activity, Industry Diversification & A Defense Contract Monopoly Will Push BWXT For Healthy Long-Term Growth
Fair Value US$220.00|15.2% undervalued
CL
Community Contributor
A case for Cassiar Gold Corp (TSXV: GLDC) to reach CAD$8-10 before 2030 (X30-37)
Fair Value CA$10.00|96.0% undervalued
AG
Community Contributor