
Advertisement
- Belgium
- /
- Oil and Gas
- /
- ENXTBR:CMBT
Should You Like Euronav NV’s (EBR:EURN) High Return On Capital Employed?

Today we are going to look at Euronav NV (EBR:EURN) to see whether it might be an attractive investment prospect. In particular, we'll consider its Return On Capital Employed (ROCE), as that can give us insight into how profitably the company is able to employ capital in its business.
First up, we'll look at what ROCE is and how we calculate it. Second, we'll look at its ROCE compared to similar companies. Then we'll determine how its current liabilities are affecting its ROCE.
Return On Capital Employed (ROCE): What is it?
ROCE is a measure of a company's yearly pre-tax profit (its return), relative to the capital employed in the business. All else being equal, a better business will have a higher ROCE. In brief, it is a useful tool, but it is not without drawbacks. Renowned investment researcher Michael Mauboussin has suggested that a high ROCE can indicate that 'one dollar invested in the company generates value of more than one dollar'.
So, How Do We Calculate ROCE?
The formula for calculating the return on capital employed is:
Return on Capital Employed = Earnings Before Interest and Tax (EBIT) ÷ (Total Assets - Current Liabilities)
Or for Euronav:
0.098 = US$376m ÷ (US$4.2b - US$348m) (Based on the trailing twelve months to March 2020.)
So, Euronav has an ROCE of 9.8%.
View our latest analysis for Euronav
Does Euronav Have A Good ROCE?
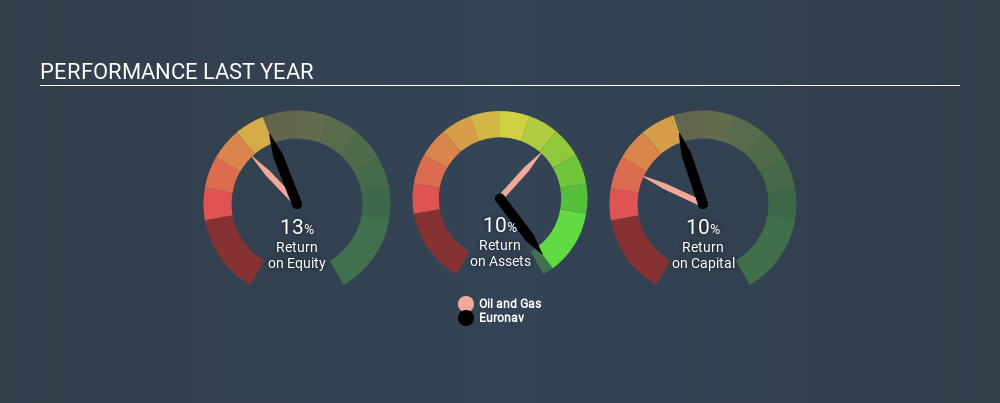
One way to assess ROCE is to compare similar companies. Euronav's ROCE appears to be substantially greater than the 7.6% average in the Oil and Gas industry. We consider this a positive sign, because it suggests it uses capital more efficiently than similar companies. Independently of how Euronav compares to its industry, its ROCE in absolute terms appears decent, and the company may be worthy of closer investigation.
We can see that, Euronav currently has an ROCE of 9.8% compared to its ROCE 3 years ago, which was 4.2%. This makes us think about whether the company has been reinvesting shrewdly. You can click on the image below to see (in greater detail) how Euronav's past growth compares to other companies.
It is important to remember that ROCE shows past performance, and is not necessarily predictive. ROCE can be misleading for companies in cyclical industries, with returns looking impressive during the boom times, but very weak during the busts. This is because ROCE only looks at one year, instead of considering returns across a whole cycle. Remember that most companies like Euronav are cyclical businesses. What happens in the future is pretty important for investors, so we have prepared a free report on analyst forecasts for Euronav.
Euronav's Current Liabilities And Their Impact On Its ROCE
Current liabilities include invoices, such as supplier payments, short-term debt, or a tax bill, that need to be paid within 12 months. Due to the way the ROCE equation works, having large bills due in the near term can make it look as though a company has less capital employed, and thus a higher ROCE than usual. To check the impact of this, we calculate if a company has high current liabilities relative to its total assets.
Euronav has current liabilities of US$348m and total assets of US$4.2b. Therefore its current liabilities are equivalent to approximately 8.3% of its total assets. With low current liabilities, Euronav's decent ROCE looks that much more respectable.
What We Can Learn From Euronav's ROCE
If Euronav can continue reinvesting in its business, it could be an attractive prospect. There might be better investments than Euronav out there, but you will have to work hard to find them . These promising businesses with rapidly growing earnings might be right up your alley.
I will like Euronav better if I see some big insider buys. While we wait, check out this free list of growing companies with considerable, recent, insider buying.
Love or hate this article? Concerned about the content? Get in touch with us directly. Alternatively, email editorial-team@simplywallst.com.
This article by Simply Wall St is general in nature. It does not constitute a recommendation to buy or sell any stock, and does not take account of your objectives, or your financial situation. We aim to bring you long-term focused analysis driven by fundamental data. Note that our analysis may not factor in the latest price-sensitive company announcements or qualitative material. Simply Wall St has no position in any stocks mentioned. Thank you for reading.
About ENXTBR:CMBT
Moderate average dividend payer.
Similar Companies
Market Insights


Advertisement
Community Narratives
Rocket Lab USA Will Ignite a 30% Revenue Growth Journey
Fair Value US$31.72|41.3% undervalued
KI
Community Contributor
EasyJet weirdly unloved by investors in spite of relatively attractive metrics
Fair Value UK£6.95|33.9% undervalued
PI
Community Contributor
HEXPOL AB: Sustained Long Term Growth, Stable Margins, and Strategic M&A
Fair Value SEK 122.27|27.0% undervalued
MA
Community Contributor