
Advertisement
- Australia
- /
- Gas Utilities
- /
- ASX:APA
APA Group (ASX:APA) investors are sitting on a loss of 14% if they invested three years ago
While it may not be enough for some shareholders, we think it is good to see the APA Group (ASX:APA) share price up 18% in a single quarter. But that doesn't help the fact that the three year return is less impressive. In fact, the share price is down 28% in the last three years, falling well short of the market return.
Now let's have a look at the company's fundamentals, and see if the long term shareholder return has matched the performance of the underlying business.
Our free stock report includes 2 warning signs investors should be aware of before investing in APA Group. Read for free now.While the efficient markets hypothesis continues to be taught by some, it has been proven that markets are over-reactive dynamic systems, and investors are not always rational. One flawed but reasonable way to assess how sentiment around a company has changed is to compare the earnings per share (EPS) with the share price.
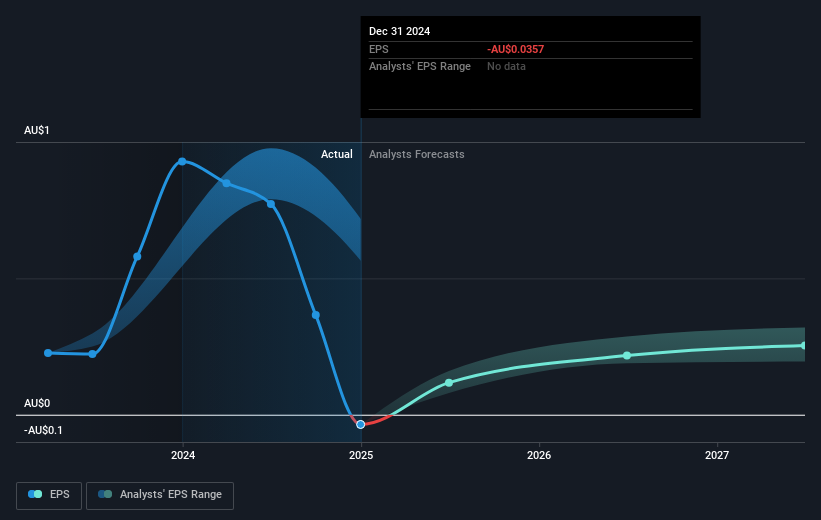
APA Group saw its share price decline over the three years in which its EPS also dropped, falling to a loss. Extraordinary items contributed to this situation. Due to the loss, it's not easy to use EPS as a reliable guide to the business. But it's safe to say we'd generally expect the share price to be lower as a result!
You can see how EPS has changed over time in the image below (click on the chart to see the exact values).
It's probably worth noting we've seen significant insider buying in the last quarter, which we consider a positive. That said, we think earnings and revenue growth trends are even more important factors to consider. It might be well worthwhile taking a look at our free report on APA Group's earnings, revenue and cash flow.
What About Dividends?
When looking at investment returns, it is important to consider the difference between total shareholder return (TSR) and share price return. Whereas the share price return only reflects the change in the share price, the TSR includes the value of dividends (assuming they were reinvested) and the benefit of any discounted capital raising or spin-off. So for companies that pay a generous dividend, the TSR is often a lot higher than the share price return. As it happens, APA Group's TSR for the last 3 years was -14%, which exceeds the share price return mentioned earlier. This is largely a result of its dividend payments!
A Different Perspective
APA Group shareholders have received returns of 5.5% over twelve months (even including dividends), which isn't far from the general market return. To take a positive view, the gain is pleasing, and it sure beats annualized TSR loss of 0.2%, which was endured over half a decade. We're pretty skeptical of turnaround stories, but it's good to see the recent share price recovery. It's always interesting to track share price performance over the longer term. But to understand APA Group better, we need to consider many other factors. Consider risks, for instance. Every company has them, and we've spotted 2 warning signs for APA Group you should know about.
There are plenty of other companies that have insiders buying up shares. You probably do not want to miss this free list of undervalued small cap companies that insiders are buying.
Please note, the market returns quoted in this article reflect the market weighted average returns of stocks that currently trade on Australian exchanges.
New: Manage All Your Stock Portfolios in One Place
We've created the ultimate portfolio companion for stock investors, and it's free.
• Connect an unlimited number of Portfolios and see your total in one currency
• Be alerted to new Warning Signs or Risks via email or mobile
• Track the Fair Value of your stocks
Have feedback on this article? Concerned about the content? Get in touch with us directly. Alternatively, email editorial-team (at) simplywallst.com.
This article by Simply Wall St is general in nature. We provide commentary based on historical data and analyst forecasts only using an unbiased methodology and our articles are not intended to be financial advice. It does not constitute a recommendation to buy or sell any stock, and does not take account of your objectives, or your financial situation. We aim to bring you long-term focused analysis driven by fundamental data. Note that our analysis may not factor in the latest price-sensitive company announcements or qualitative material. Simply Wall St has no position in any stocks mentioned.
About ASX:APA
Reasonable growth potential average dividend payer.
Similar Companies
Market Insights

Advertisement
Community Narratives
Quality at a Premium. A time to watch, not to buy?
Fair Value US$154.56|26.1% undervalued
DA
Community Contributor
GRAB: The Super-App at the Heart of Southeast Asia’s Digital Boom
Fair Value US$8.20|21.3% undervalued
BL
Community Contributor
Verve Group to Surge with 51.61% Revenue Growth
Fair Value €6.00|61.2% undervalued
ME
Community Contributor