
Advertisement
- Australia
- /
- Infrastructure
- /
- ASX:TCL
Transurban Group (ASX:TCL) shareholders have earned a 6.0% CAGR over the last five years
The main point of investing for the long term is to make money. Better yet, you'd like to see the share price move up more than the market average. But Transurban Group (ASX:TCL) has fallen short of that second goal, with a share price rise of 12% over five years, which is below the market return. The last year has been disappointing, with the stock price down 7.5% in that time.
Let's take a look at the underlying fundamentals over the longer term, and see if they've been consistent with shareholders returns.
View our latest analysis for Transurban Group
We don't think that Transurban Group's modest trailing twelve month profit has the market's full attention at the moment. We think revenue is probably a better guide. Generally speaking, we'd consider a stock like this alongside loss-making companies, simply because the quantum of the profit is so low. It would be hard to believe in a more profitable future without growing revenues.
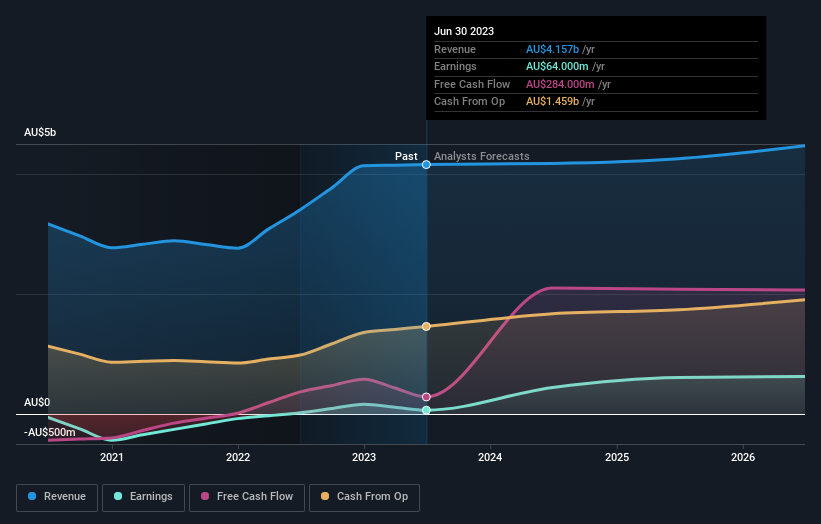
In the last 5 years Transurban Group saw its revenue shrink by 0.2% per year. The falling revenue is arguably somewhat reflected in the lacklustre return of 2% per year over that time. Arguably that's not bad given the soft revenue and loss-making position. We'd keep an eye on changes in the trend - there may be an opportunity if the company returns to growth.
You can see how earnings and revenue have changed over time in the image below (click on the chart to see the exact values).
It's probably worth noting we've seen significant insider buying in the last quarter, which we consider a positive. That said, we think earnings and revenue growth trends are even more important factors to consider. You can see what analysts are predicting for Transurban Group in this interactive graph of future profit estimates.
What About Dividends?
As well as measuring the share price return, investors should also consider the total shareholder return (TSR). The TSR is a return calculation that accounts for the value of cash dividends (assuming that any dividend received was reinvested) and the calculated value of any discounted capital raisings and spin-offs. So for companies that pay a generous dividend, the TSR is often a lot higher than the share price return. As it happens, Transurban Group's TSR for the last 5 years was 34%, which exceeds the share price return mentioned earlier. This is largely a result of its dividend payments!
A Different Perspective
Investors in Transurban Group had a tough year, with a total loss of 3.5% (including dividends), against a market gain of about 3.0%. However, keep in mind that even the best stocks will sometimes underperform the market over a twelve month period. On the bright side, long term shareholders have made money, with a gain of 6% per year over half a decade. It could be that the recent sell-off is an opportunity, so it may be worth checking the fundamental data for signs of a long term growth trend. It's always interesting to track share price performance over the longer term. But to understand Transurban Group better, we need to consider many other factors. Consider for instance, the ever-present spectre of investment risk. We've identified 3 warning signs with Transurban Group (at least 2 which are significant) , and understanding them should be part of your investment process.
There are plenty of other companies that have insiders buying up shares. You probably do not want to miss this free list of growing companies that insiders are buying.
Please note, the market returns quoted in this article reflect the market weighted average returns of stocks that currently trade on Australian exchanges.
Valuation is complex, but we're here to simplify it.
Discover if Transurban Group might be undervalued or overvalued with our detailed analysis, featuring fair value estimates, potential risks, dividends, insider trades, and its financial condition.
Access Free AnalysisHave feedback on this article? Concerned about the content? Get in touch with us directly. Alternatively, email editorial-team (at) simplywallst.com.
This article by Simply Wall St is general in nature. We provide commentary based on historical data and analyst forecasts only using an unbiased methodology and our articles are not intended to be financial advice. It does not constitute a recommendation to buy or sell any stock, and does not take account of your objectives, or your financial situation. We aim to bring you long-term focused analysis driven by fundamental data. Note that our analysis may not factor in the latest price-sensitive company announcements or qualitative material. Simply Wall St has no position in any stocks mentioned.
About ASX:TCL
Transurban Group
Engages in the development, operation, management, and maintenance of toll road networks in Australia and North America.
Moderate growth potential with low risk.
Similar Companies
Market Insights

Advertisement
Community Narratives
The "Molecular Pencil": Why Beam's Technology is Built to Win
Fair Value US$65.01|66.7% undervalued
DA
Community Contributor
The silent giant behind virtually every advanced chip powering AI, smartphones, and modern infrastructure.
Fair Value US$310.00|4.8% undervalued
OS
Community Contributor
ADP Stock: Solid Fundamentals, But AI Investments Test Its Margin Resilience
Fair Value US$387.77|34.5% undervalued
YI
Community Contributor
MINISO's fair value is projected at 26.69 with an anticipated PE ratio shift of 20x
Fair Value US$24.03|9.6% undervalued
BE
Community Contributor