- Australia
- /
- Infrastructure
- /
- ASX:QUB
Is Qube Holdings Limited (ASX:QUB) Expensive For A Reason? A Look At Its Intrinsic Value


Key Insights
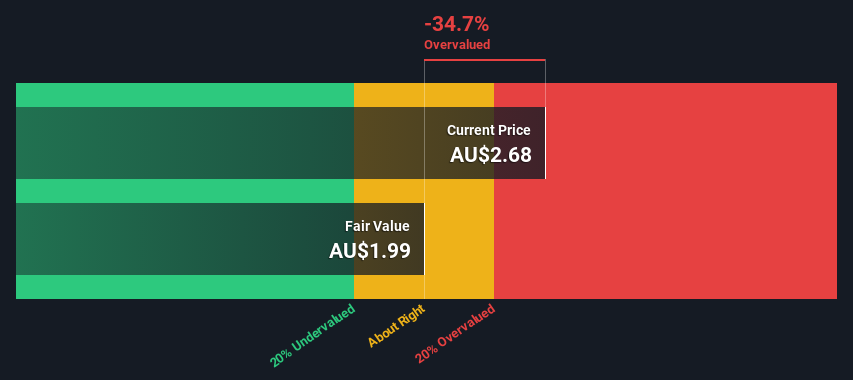
- Qube Holdings' estimated fair value is AU$1.99 based on 2 Stage Free Cash Flow to Equity
- Current share price of AU$2.68 suggests Qube Holdings is potentially 35% overvalued
- Analyst price target for QUB is AU$3.45, which is 73% above our fair value estimate
Today we will run through one way of estimating the intrinsic value of Qube Holdings Limited (ASX:QUB) by taking the forecast future cash flows of the company and discounting them back to today's value. This will be done using the Discounted Cash Flow (DCF) model. Models like these may appear beyond the comprehension of a lay person, but they're fairly easy to follow.
Remember though, that there are many ways to estimate a company's value, and a DCF is just one method. For those who are keen learners of equity analysis, the Simply Wall St analysis model here may be something of interest to you.
View our latest analysis for Qube Holdings
Is Qube Holdings Fairly Valued?
We are going to use a two-stage DCF model, which, as the name states, takes into account two stages of growth. The first stage is generally a higher growth period which levels off heading towards the terminal value, captured in the second 'steady growth' period. To start off with, we need to estimate the next ten years of cash flows. Where possible we use analyst estimates, but when these aren't available we extrapolate the previous free cash flow (FCF) from the last estimate or reported value. We assume companies with shrinking free cash flow will slow their rate of shrinkage, and that companies with growing free cash flow will see their growth rate slow, over this period. We do this to reflect that growth tends to slow more in the early years than it does in later years.
Generally we assume that a dollar today is more valuable than a dollar in the future, so we discount the value of these future cash flows to their estimated value in today's dollars:
10-year free cash flow (FCF) forecast
| 2024 | 2025 | 2026 | 2027 | 2028 | 2029 | 2030 | 2031 | 2032 | 2033 | |
| Levered FCF (A$, Millions) | -AU$45.9m | AU$94.2m | AU$173.5m | AU$202.6m | AU$223.5m | AU$238.9m | AU$251.8m | AU$262.9m | AU$272.6m | AU$281.3m |
| Growth Rate Estimate Source | Analyst x6 | Analyst x5 | Analyst x5 | Analyst x2 | Analyst x2 | Est @ 6.89% | Est @ 5.43% | Est @ 4.40% | Est @ 3.68% | Est @ 3.18% |
| Present Value (A$, Millions) Discounted @ 7.8% | -AU$42.6 | AU$81.0 | AU$138 | AU$150 | AU$153 | AU$152 | AU$149 | AU$144 | AU$138 | AU$132 |
("Est" = FCF growth rate estimated by Simply Wall St)
Present Value of 10-year Cash Flow (PVCF) = AU$1.2b
After calculating the present value of future cash flows in the initial 10-year period, we need to calculate the Terminal Value, which accounts for all future cash flows beyond the first stage. The Gordon Growth formula is used to calculate Terminal Value at a future annual growth rate equal to the 5-year average of the 10-year government bond yield of 2.0%. We discount the terminal cash flows to today's value at a cost of equity of 7.8%.
Terminal Value (TV)= FCF2033 × (1 + g) ÷ (r – g) = AU$281m× (1 + 2.0%) ÷ (7.8%– 2.0%) = AU$4.9b
Present Value of Terminal Value (PVTV)= TV / (1 + r)10= AU$4.9b÷ ( 1 + 7.8%)10= AU$2.3b
The total value is the sum of cash flows for the next ten years plus the discounted terminal value, which results in the Total Equity Value, which in this case is AU$3.5b. To get the intrinsic value per share, we divide this by the total number of shares outstanding. Relative to the current share price of AU$2.7, the company appears potentially overvalued at the time of writing. Remember though, that this is just an approximate valuation, and like any complex formula - garbage in, garbage out.
Important Assumptions
We would point out that the most important inputs to a discounted cash flow are the discount rate and of course the actual cash flows. Part of investing is coming up with your own evaluation of a company's future performance, so try the calculation yourself and check your own assumptions. The DCF also does not consider the possible cyclicality of an industry, or a company's future capital requirements, so it does not give a full picture of a company's potential performance. Given that we are looking at Qube Holdings as potential shareholders, the cost of equity is used as the discount rate, rather than the cost of capital (or weighted average cost of capital, WACC) which accounts for debt. In this calculation we've used 7.8%, which is based on a levered beta of 1.164. Beta is a measure of a stock's volatility, compared to the market as a whole. We get our beta from the industry average beta of globally comparable companies, with an imposed limit between 0.8 and 2.0, which is a reasonable range for a stable business.
SWOT Analysis for Qube Holdings
- Earnings growth over the past year exceeded the industry.
- Debt is not viewed as a risk.
- Dividend is low compared to the top 25% of dividend payers in the Infrastructure market.
- Expensive based on P/E ratio and estimated fair value.
- Annual earnings are forecast to grow faster than the Australian market.
- Paying a dividend but company has no free cash flows.
- Revenue is forecast to grow slower than 20% per year.
Moving On:
Valuation is only one side of the coin in terms of building your investment thesis, and it shouldn't be the only metric you look at when researching a company. DCF models are not the be-all and end-all of investment valuation. Preferably you'd apply different cases and assumptions and see how they would impact the company's valuation. For example, changes in the company's cost of equity or the risk free rate can significantly impact the valuation. Can we work out why the company is trading at a premium to intrinsic value? For Qube Holdings, we've put together three fundamental aspects you should explore:
- Risks: We feel that you should assess the 1 warning sign for Qube Holdings we've flagged before making an investment in the company.
- Future Earnings: How does QUB's growth rate compare to its peers and the wider market? Dig deeper into the analyst consensus number for the upcoming years by interacting with our free analyst growth expectation chart.
- Other High Quality Alternatives: Do you like a good all-rounder? Explore our interactive list of high quality stocks to get an idea of what else is out there you may be missing!
PS. Simply Wall St updates its DCF calculation for every Australian stock every day, so if you want to find the intrinsic value of any other stock just search here.
Valuation is complex, but we're here to simplify it.
Discover if Qube Holdings might be undervalued or overvalued with our detailed analysis, featuring fair value estimates, potential risks, dividends, insider trades, and its financial condition.
Access Free AnalysisHave feedback on this article? Concerned about the content? Get in touch with us directly. Alternatively, email editorial-team (at) simplywallst.com.
This article by Simply Wall St is general in nature. We provide commentary based on historical data and analyst forecasts only using an unbiased methodology and our articles are not intended to be financial advice. It does not constitute a recommendation to buy or sell any stock, and does not take account of your objectives, or your financial situation. We aim to bring you long-term focused analysis driven by fundamental data. Note that our analysis may not factor in the latest price-sensitive company announcements or qualitative material. Simply Wall St has no position in any stocks mentioned.
About ASX:QUB
Qube Holdings
Provides logistics solutions for import and export supply chain in Australia, New Zealand, and Southeast Asia.
Moderate growth potential with acceptable track record.
Similar Companies
Market Insights

Community Narratives

