
Advertisement
Here's How P/E Ratios Can Help Us Understand Macquarie Telecom Group Limited (ASX:MAQ)

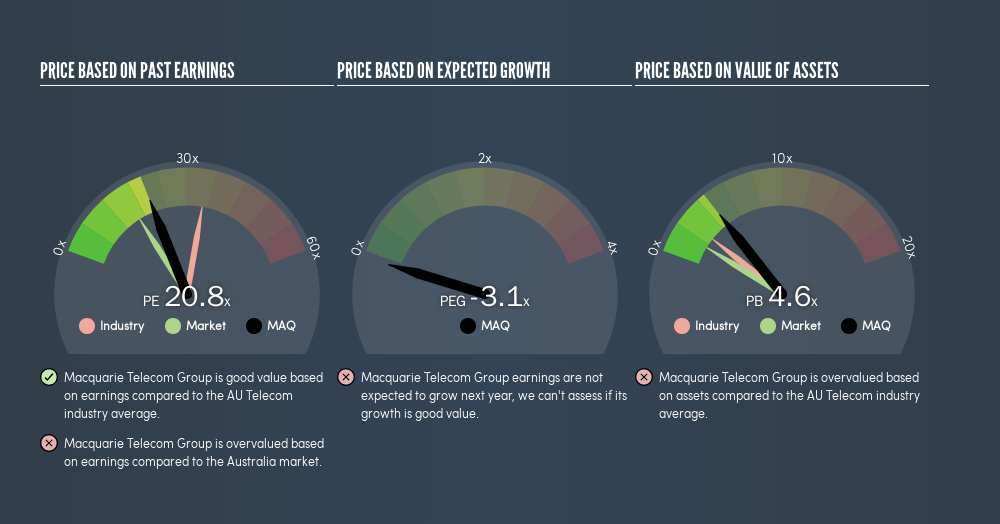
The goal of this article is to teach you how to use price to earnings ratios (P/E ratios). We'll look at Macquarie Telecom Group Limited's (ASX:MAQ) P/E ratio and reflect on what it tells us about the company's share price. Based on the last twelve months, Macquarie Telecom Group's P/E ratio is 20.76. That means that at current prices, buyers pay A$20.76 for every A$1 in trailing yearly profits.
Check out our latest analysis for Macquarie Telecom Group
How Do I Calculate A Price To Earnings Ratio?
The formula for P/E is:
Price to Earnings Ratio = Price per Share ÷ Earnings per Share (EPS)
Or for Macquarie Telecom Group:
P/E of 20.76 = A$20.9 ÷ A$1.01 (Based on the year to December 2018.)
Is A High P/E Ratio Good?
A higher P/E ratio means that investors are paying a higher price for each A$1 of company earnings. All else being equal, it's better to pay a low price -- but as Warren Buffett said, 'It's far better to buy a wonderful company at a fair price than a fair company at a wonderful price.'
How Growth Rates Impact P/E Ratios
P/E ratios primarily reflect market expectations around earnings growth rates. When earnings grow, the 'E' increases, over time. That means even if the current P/E is high, it will reduce over time if the share price stays flat. Then, a lower P/E should attract more buyers, pushing the share price up.
Macquarie Telecom Group increased earnings per share by a whopping 32% last year. And earnings per share have improved by 59% annually, over the last five years. I'd therefore be a little surprised if its P/E ratio was not relatively high.
How Does Macquarie Telecom Group's P/E Ratio Compare To Its Peers?
We can get an indication of market expectations by looking at the P/E ratio. The image below shows that Macquarie Telecom Group has a lower P/E than the average (34.2) P/E for companies in the telecom industry.
Macquarie Telecom Group's P/E tells us that market participants think it will not fare as well as its peers in the same industry. Since the market seems unimpressed with Macquarie Telecom Group, it's quite possible it could surprise on the upside. It is arguably worth checking if insiders are buying shares, because that might imply they believe the stock is undervalued.
A Limitation: P/E Ratios Ignore Debt and Cash In The Bank
It's important to note that the P/E ratio considers the market capitalization, not the enterprise value. In other words, it does not consider any debt or cash that the company may have on the balance sheet. Hypothetically, a company could reduce its future P/E ratio by spending its cash (or taking on debt) to achieve higher earnings.
Spending on growth might be good or bad a few years later, but the point is that the P/E ratio does not account for the option (or lack thereof).
How Does Macquarie Telecom Group's Debt Impact Its P/E Ratio?
Macquarie Telecom Group has net cash of AU$14m. That should lead to a higher P/E than if it did have debt, because its strong balance sheets gives it more options.
The Verdict On Macquarie Telecom Group's P/E Ratio
Macquarie Telecom Group's P/E is 20.8 which is above average (16.2) in the AU market. With cash in the bank the company has plenty of growth options -- and it is already on the right track. So it does not seem strange that the P/E is above average.
Investors have an opportunity when market expectations about a stock are wrong. If the reality for a company is better than it expects, you can make money by buying and holding for the long term. So this freevisualization of the analyst consensus on future earnings could help you make the right decision about whether to buy, sell, or hold.
Of course you might be able to find a better stock than Macquarie Telecom Group. So you may wish to see this freecollection of other companies that have grown earnings strongly.
We aim to bring you long-term focused research analysis driven by fundamental data. Note that our analysis may not factor in the latest price-sensitive company announcements or qualitative material.
If you spot an error that warrants correction, please contact the editor at editorial-team@simplywallst.com. This article by Simply Wall St is general in nature. It does not constitute a recommendation to buy or sell any stock, and does not take account of your objectives, or your financial situation. Simply Wall St has no position in the stocks mentioned. Thank you for reading.
About ASX:MAQ
Macquarie Technology Group
Provides telecommunication, cloud computing, cybersecurity, and data center services to corporate and government customers in Australia.
Excellent balance sheet with proven track record.
Similar Companies
Market Insights


Advertisement
Community Narratives
The Future of Drug Testing? Fingerprint Tech Shows Serious Promise
Fair Value US$2.98|40.3% undervalued
JO
Community Contributor
Suncorp’s Next Chapter: Insurance-Only and Ready to Grow
Fair Value AU$22.83|7.9% undervalued
RO
Community Contributor
Thyssenkrupp Nucera Will Achieve Double-Digit Profits by 2030 Boosted by Hydrogen Growth
Fair Value €14.40|31.6% undervalued
CH
Community Contributor
Tesla’s Nvidia Moment – The AI & Robotics Inflection Point
Fair Value US$359.72|12.3% undervalued
BL
Community Contributor