
Advertisement
Codan Limited (ASX:CDA) surges 6.2%; individual investors who own 44% shares profited along with insiders
Key Insights
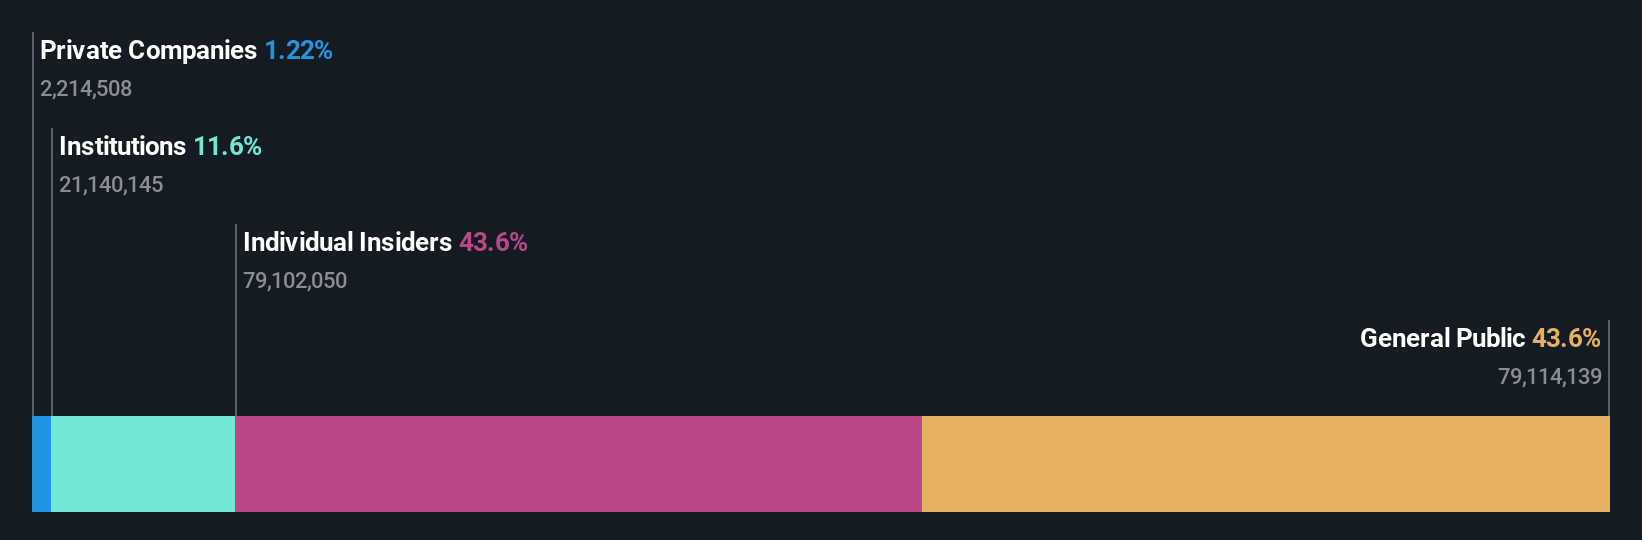
- The considerable ownership by individual investors in Codan indicates that they collectively have a greater say in management and business strategy
- 51% of the business is held by the top 10 shareholders
- Insiders own 44% of Codan
A look at the shareholders of Codan Limited (ASX:CDA) can tell us which group is most powerful. The group holding the most number of shares in the company, around 44% to be precise, is individual investors. Put another way, the group faces the maximum upside potential (or downside risk).
While individual investors were the group that benefitted the most from last week’s AU$205m market cap gain, insiders too had a 44% share in those profits.
Let's delve deeper into each type of owner of Codan, beginning with the chart below.
Check out our latest analysis for Codan
What Does The Institutional Ownership Tell Us About Codan?
Institutions typically measure themselves against a benchmark when reporting to their own investors, so they often become more enthusiastic about a stock once it's included in a major index. We would expect most companies to have some institutions on the register, especially if they are growing.
As you can see, institutional investors have a fair amount of stake in Codan. This suggests some credibility amongst professional investors. But we can't rely on that fact alone since institutions make bad investments sometimes, just like everyone does. If multiple institutions change their view on a stock at the same time, you could see the share price drop fast. It's therefore worth looking at Codan's earnings history below. Of course, the future is what really matters.
Codan is not owned by hedge funds. Our data shows that P. Wall is the largest shareholder with 19% of shares outstanding. Meanwhile, the second and third largest shareholders, hold 15% and 4.1%, of the shares outstanding, respectively.
We also observed that the top 10 shareholders account for more than half of the share register, with a few smaller shareholders to balance the interests of the larger ones to a certain extent.
While studying institutional ownership for a company can add value to your research, it is also a good practice to research analyst recommendations to get a deeper understand of a stock's expected performance. There are plenty of analysts covering the stock, so it might be worth seeing what they are forecasting, too.
Insider Ownership Of Codan
The definition of company insiders can be subjective and does vary between jurisdictions. Our data reflects individual insiders, capturing board members at the very least. The company management answer to the board and the latter should represent the interests of shareholders. Notably, sometimes top-level managers are on the board themselves.
I generally consider insider ownership to be a good thing. However, on some occasions it makes it more difficult for other shareholders to hold the board accountable for decisions.
Our most recent data indicates that insiders own a reasonable proportion of Codan Limited. Insiders own AU$1.5b worth of shares in the AU$3.5b company. That's quite meaningful. Most would be pleased to see the board is investing alongside them. You may wish to access this free chart showing recent trading by insiders.
General Public Ownership
The general public-- including retail investors -- own 44% stake in the company, and hence can't easily be ignored. While this size of ownership may not be enough to sway a policy decision in their favour, they can still make a collective impact on company policies.
Next Steps:
It's always worth thinking about the different groups who own shares in a company. But to understand Codan better, we need to consider many other factors.
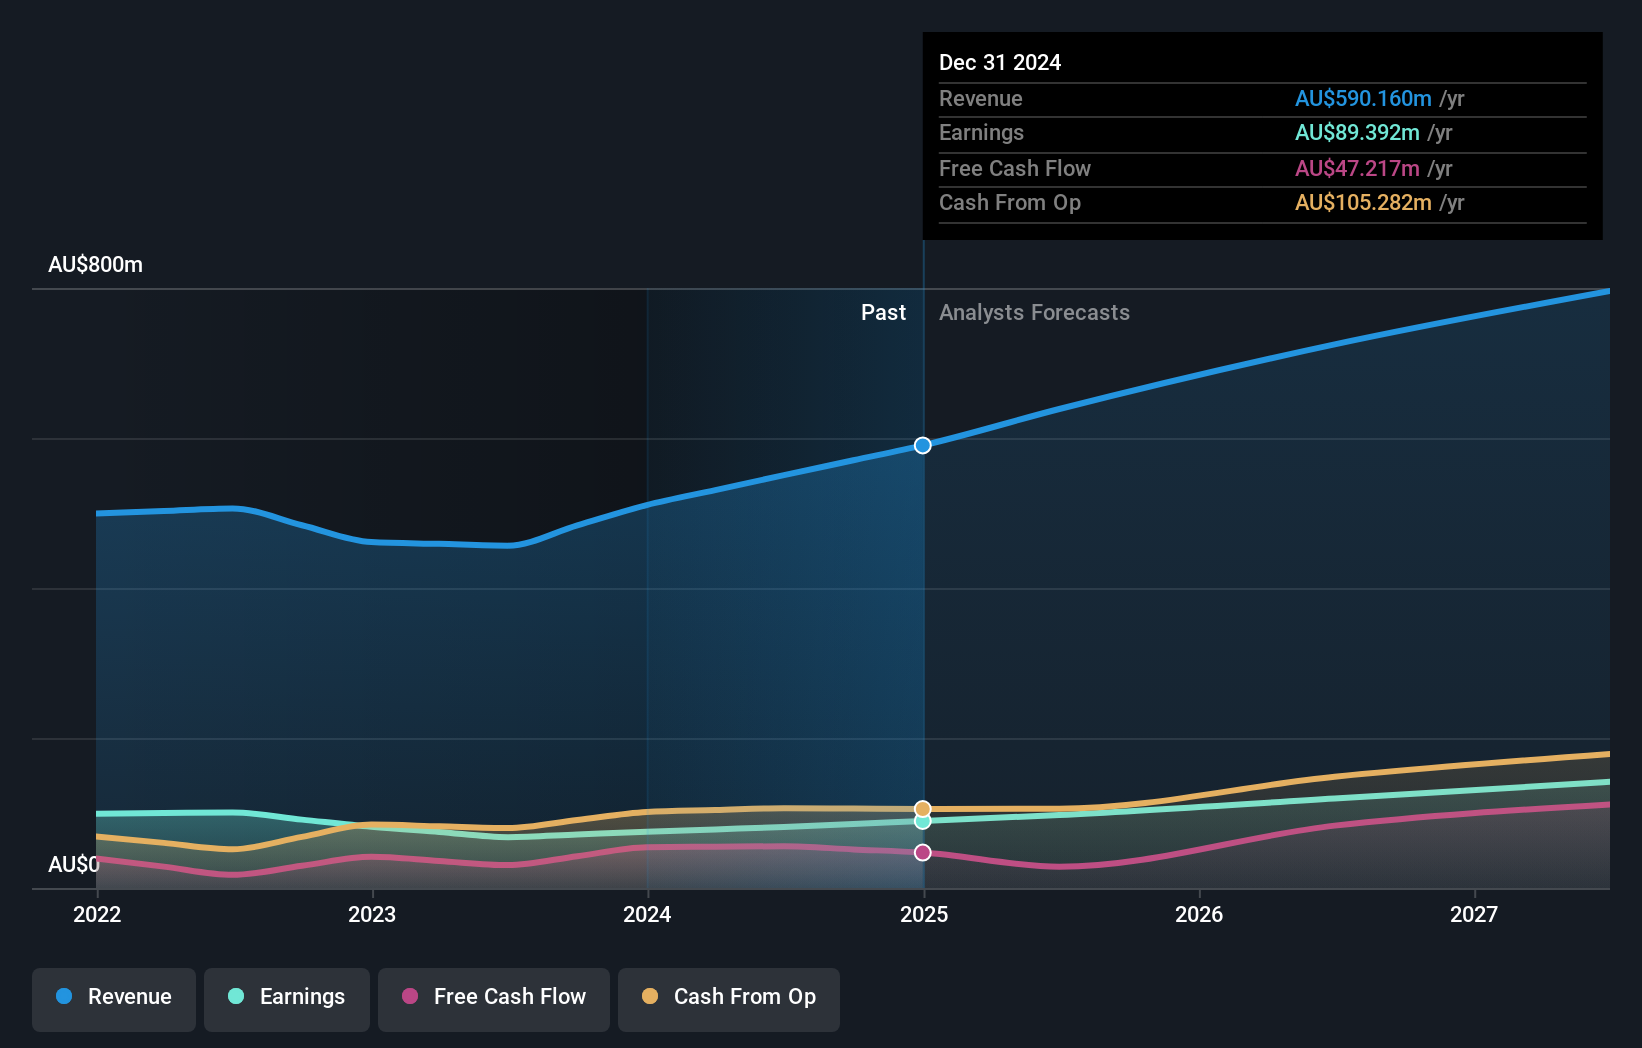
Many find it useful to take an in depth look at how a company has performed in the past. You can access this detailed graph of past earnings, revenue and cash flow.
But ultimately it is the future, not the past, that will determine how well the owners of this business will do. Therefore we think it advisable to take a look at this free report showing whether analysts are predicting a brighter future.
NB: Figures in this article are calculated using data from the last twelve months, which refer to the 12-month period ending on the last date of the month the financial statement is dated. This may not be consistent with full year annual report figures.
New: AI Stock Screener & Alerts
Our new AI Stock Screener scans the market every day to uncover opportunities.
• Dividend Powerhouses (3%+ Yield)
• Undervalued Small Caps with Insider Buying
• High growth Tech and AI Companies
Or build your own from over 50 metrics.
Have feedback on this article? Concerned about the content? Get in touch with us directly. Alternatively, email editorial-team (at) simplywallst.com.
This article by Simply Wall St is general in nature. We provide commentary based on historical data and analyst forecasts only using an unbiased methodology and our articles are not intended to be financial advice. It does not constitute a recommendation to buy or sell any stock, and does not take account of your objectives, or your financial situation. We aim to bring you long-term focused analysis driven by fundamental data. Note that our analysis may not factor in the latest price-sensitive company announcements or qualitative material. Simply Wall St has no position in any stocks mentioned.
About ASX:CDA
Codan
Develops technology solutions for United Nations organizations, security and military agencies, government departments, corporates, individuals consumers, and small-scale miners.
Solid track record with excellent balance sheet.
Similar Companies
Market Insights

Advertisement
Community Narratives
MINISO's fair value is projected at 26.69 with an anticipated PE ratio shift of 20x
Fair Value US$24.03|11.0% undervalued
BE
Community Contributor
Procter & Gamble: A Dividend Giant Facing Slowing Growth
Fair Value US$119.81|23.3% overvalued
AN
Community Contributor
Eli Lilly's Future Growth Driven by Tirzepatide and Favorable Market Conditions
Fair Value US$1.19k|13.8% undervalued
EA
Community Contributor