Has Altium Limited's (ASX:ALU) Impressive Stock Performance Got Anything to Do With Its Fundamentals?


Most readers would already be aware that Altium's (ASX:ALU) stock increased significantly by 21% over the past three months. We wonder if and what role the company's financials play in that price change as a company's long-term fundamentals usually dictate market outcomes. In this article, we decided to focus on Altium's ROE.
Return on Equity or ROE is a test of how effectively a company is growing its value and managing investors’ money. Put another way, it reveals the company's success at turning shareholder investments into profits.
Check out our latest analysis for Altium
How Is ROE Calculated?
The formula for return on equity is:
Return on Equity = Net Profit (from continuing operations) ÷ Shareholders' Equity
So, based on the above formula, the ROE for Altium is:
22% = US$66m ÷ US$304m (Based on the trailing twelve months to June 2023).
The 'return' refers to a company's earnings over the last year. One way to conceptualize this is that for each A$1 of shareholders' capital it has, the company made A$0.22 in profit.
Why Is ROE Important For Earnings Growth?
Thus far, we have learned that ROE measures how efficiently a company is generating its profits. Depending on how much of these profits the company reinvests or "retains", and how effectively it does so, we are then able to assess a company’s earnings growth potential. Assuming everything else remains unchanged, the higher the ROE and profit retention, the higher the growth rate of a company compared to companies that don't necessarily bear these characteristics.
A Side By Side comparison of Altium's Earnings Growth And 22% ROE
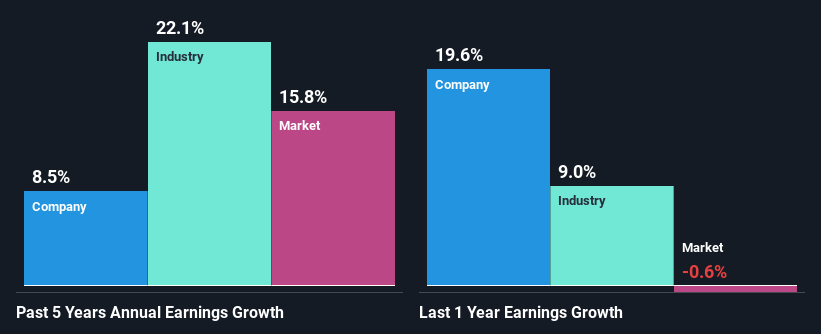
At first glance, Altium seems to have a decent ROE. On comparing with the average industry ROE of 9.4% the company's ROE looks pretty remarkable. Probably as a result of this, Altium was able to see a decent growth of 8.5% over the last five years.
We then compared Altium's net income growth with the industry and found that the company's growth figure is lower than the average industry growth rate of 22% in the same 5-year period, which is a bit concerning.
Earnings growth is a huge factor in stock valuation. It’s important for an investor to know whether the market has priced in the company's expected earnings growth (or decline). This then helps them determine if the stock is placed for a bright or bleak future. One good indicator of expected earnings growth is the P/E ratio which determines the price the market is willing to pay for a stock based on its earnings prospects. So, you may want to check if Altium is trading on a high P/E or a low P/E, relative to its industry.
Is Altium Making Efficient Use Of Its Profits?
Altium has a significant three-year median payout ratio of 97%, meaning that it is left with only 3.3% to reinvest into its business. This implies that the company has been able to achieve decent earnings growth despite returning most of its profits to shareholders.
Besides, Altium has been paying dividends for at least ten years or more. This shows that the company is committed to sharing profits with its shareholders. Our latest analyst data shows that the future payout ratio of the company is expected to drop to 71% over the next three years. Accordingly, the expected drop in the payout ratio explains the expected increase in the company's ROE to 33%, over the same period.
Conclusion
Overall, we feel that Altium certainly does have some positive factors to consider. Its earnings have grown respectably as we saw earlier, probably due to its high returns. However, it does reinvest little to almost none of its profits, so we wonder what effect this could have on its future growth prospects. Having said that, looking at the current analyst estimates, we found that the company's earnings are expected to gain momentum. To know more about the latest analysts predictions for the company, check out this visualization of analyst forecasts for the company.
New: Manage All Your Stock Portfolios in One Place
We've created the ultimate portfolio companion for stock investors, and it's free.
• Connect an unlimited number of Portfolios and see your total in one currency
• Be alerted to new Warning Signs or Risks via email or mobile
• Track the Fair Value of your stocks
Have feedback on this article? Concerned about the content? Get in touch with us directly. Alternatively, email editorial-team (at) simplywallst.com.
This article by Simply Wall St is general in nature. We provide commentary based on historical data and analyst forecasts only using an unbiased methodology and our articles are not intended to be financial advice. It does not constitute a recommendation to buy or sell any stock, and does not take account of your objectives, or your financial situation. We aim to bring you long-term focused analysis driven by fundamental data. Note that our analysis may not factor in the latest price-sensitive company announcements or qualitative material. Simply Wall St has no position in any stocks mentioned.
About ASX:ALU
Altium
Develops and sells computer software for the design of electronic products in the United States and internationally.
Flawless balance sheet with high growth potential.

