- Australia
- /
- Specialty Stores
- /
- ASX:NCK
Nick Scali's (ASX:NCK) earnings growth rate lags the 21% CAGR delivered to shareholders


Generally speaking the aim of active stock picking is to find companies that provide returns that are superior to the market average. Buying under-rated businesses is one path to excess returns. For example, the Nick Scali Limited (ASX:NCK) share price is up 90% in the last 5 years, clearly besting the market return of around 22% (ignoring dividends). On the other hand, the more recent gains haven't been so impressive, with shareholders gaining just 63%, including dividends.
In light of the stock dropping 6.8% in the past week, we want to investigate the longer term story, and see if fundamentals have been the driver of the company's positive five-year return.
Check out our latest analysis for Nick Scali
To paraphrase Benjamin Graham: Over the short term the market is a voting machine, but over the long term it's a weighing machine. One way to examine how market sentiment has changed over time is to look at the interaction between a company's share price and its earnings per share (EPS).
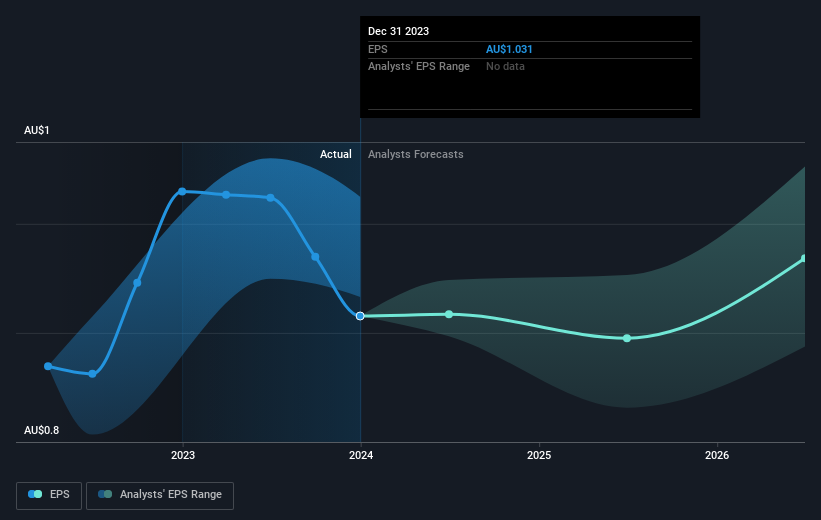
Over half a decade, Nick Scali managed to grow its earnings per share at 13% a year. This EPS growth is remarkably close to the 14% average annual increase in the share price. This indicates that investor sentiment towards the company has not changed a great deal. Indeed, it would appear the share price is reacting to the EPS.
You can see how EPS has changed over time in the image below (click on the chart to see the exact values).
It's probably worth noting we've seen significant insider buying in the last quarter, which we consider a positive. On the other hand, we think the revenue and earnings trends are much more meaningful measures of the business. Before buying or selling a stock, we always recommend a close examination of historic growth trends, available here..
What About Dividends?
When looking at investment returns, it is important to consider the difference between total shareholder return (TSR) and share price return. The TSR incorporates the value of any spin-offs or discounted capital raisings, along with any dividends, based on the assumption that the dividends are reinvested. So for companies that pay a generous dividend, the TSR is often a lot higher than the share price return. As it happens, Nick Scali's TSR for the last 5 years was 161%, which exceeds the share price return mentioned earlier. The dividends paid by the company have thusly boosted the total shareholder return.
A Different Perspective
It's nice to see that Nick Scali shareholders have received a total shareholder return of 63% over the last year. That's including the dividend. Since the one-year TSR is better than the five-year TSR (the latter coming in at 21% per year), it would seem that the stock's performance has improved in recent times. Given the share price momentum remains strong, it might be worth taking a closer look at the stock, lest you miss an opportunity. I find it very interesting to look at share price over the long term as a proxy for business performance. But to truly gain insight, we need to consider other information, too. Case in point: We've spotted 2 warning signs for Nick Scali you should be aware of.
Nick Scali is not the only stock insiders are buying. So take a peek at this free list of small cap companies at attractive valuations which insiders have been buying.
Please note, the market returns quoted in this article reflect the market weighted average returns of stocks that currently trade on Australian exchanges.
Valuation is complex, but we're here to simplify it.
Discover if Nick Scali might be undervalued or overvalued with our detailed analysis, featuring fair value estimates, potential risks, dividends, insider trades, and its financial condition.
Access Free AnalysisHave feedback on this article? Concerned about the content? Get in touch with us directly. Alternatively, email editorial-team (at) simplywallst.com.
This article by Simply Wall St is general in nature. We provide commentary based on historical data and analyst forecasts only using an unbiased methodology and our articles are not intended to be financial advice. It does not constitute a recommendation to buy or sell any stock, and does not take account of your objectives, or your financial situation. We aim to bring you long-term focused analysis driven by fundamental data. Note that our analysis may not factor in the latest price-sensitive company announcements or qualitative material. Simply Wall St has no position in any stocks mentioned.
About ASX:NCK
Nick Scali
Engages in sourcing and retailing of household furniture and related accessories in Australia, the United Kingdom, and New Zealand.
Excellent balance sheet established dividend payer.
Market Insights

Community Narratives


