
Advertisement
Investing in Stockland (ASX:SGP) five years ago would have delivered you a 145% gain
When we invest, we're generally looking for stocks that outperform the market average. And the truth is, you can make significant gains if you buy good quality businesses at the right price. To wit, the Stockland share price has climbed 84% in five years, easily topping the market return of 48% (ignoring dividends). However, more recent returns haven't been as impressive as that, with the stock returning just 26% in the last year, including dividends.
So let's investigate and see if the longer term performance of the company has been in line with the underlying business' progress.
While the efficient markets hypothesis continues to be taught by some, it has been proven that markets are over-reactive dynamic systems, and investors are not always rational. One flawed but reasonable way to assess how sentiment around a company has changed is to compare the earnings per share (EPS) with the share price.
During five years of share price growth, Stockland actually saw its EPS drop 2.8% per year.
By glancing at these numbers, we'd posit that the decline in earnings per share is not representative of how the business has changed over the years. Therefore, it's worth taking a look at other metrics to try to understand the share price movements.
In fact, the dividend has increased over time, which is a positive. Maybe dividend investors have helped support the share price.
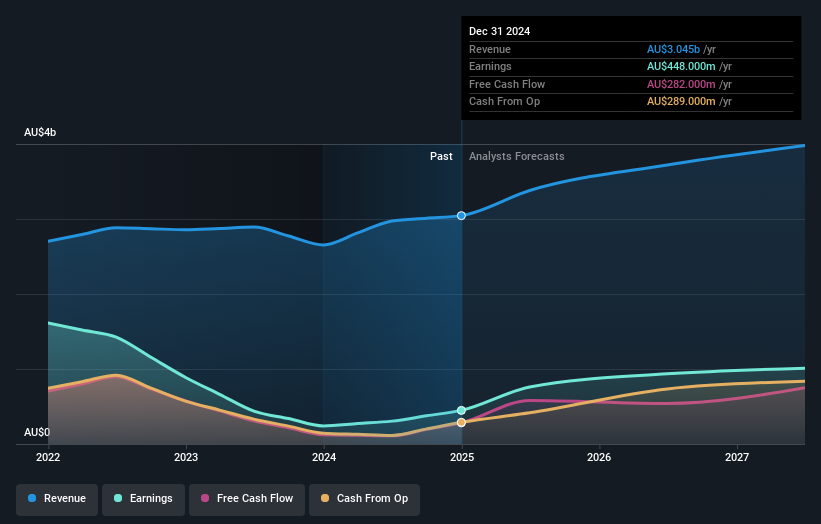
You can see how earnings and revenue have changed over time in the image below (click on the chart to see the exact values).
It's good to see that there was some significant insider buying in the last three months. That's a positive. On the other hand, we think the revenue and earnings trends are much more meaningful measures of the business. If you are thinking of buying or selling Stockland stock, you should check out this free report showing analyst profit forecasts.
What About Dividends?
When looking at investment returns, it is important to consider the difference between total shareholder return (TSR) and share price return. The TSR incorporates the value of any spin-offs or discounted capital raisings, along with any dividends, based on the assumption that the dividends are reinvested. So for companies that pay a generous dividend, the TSR is often a lot higher than the share price return. We note that for Stockland the TSR over the last 5 years was 145%, which is better than the share price return mentioned above. The dividends paid by the company have thusly boosted the total shareholder return.
A Different Perspective
It's good to see that Stockland has rewarded shareholders with a total shareholder return of 26% in the last twelve months. That's including the dividend. That gain is better than the annual TSR over five years, which is 20%. Therefore it seems like sentiment around the company has been positive lately. Someone with an optimistic perspective could view the recent improvement in TSR as indicating that the business itself is getting better with time. It's always interesting to track share price performance over the longer term. But to understand Stockland better, we need to consider many other factors. For instance, we've identified 2 warning signs for Stockland (1 can't be ignored) that you should be aware of.
There are plenty of other companies that have insiders buying up shares. You probably do not want to miss this free list of undervalued small cap companies that insiders are buying.
Please note, the market returns quoted in this article reflect the market weighted average returns of stocks that currently trade on Australian exchanges.
New: Manage All Your Stock Portfolios in One Place
We've created the ultimate portfolio companion for stock investors, and it's free.
• Connect an unlimited number of Portfolios and see your total in one currency
• Be alerted to new Warning Signs or Risks via email or mobile
• Track the Fair Value of your stocks
Have feedback on this article? Concerned about the content? Get in touch with us directly. Alternatively, email editorial-team (at) simplywallst.com.
This article by Simply Wall St is general in nature. We provide commentary based on historical data and analyst forecasts only using an unbiased methodology and our articles are not intended to be financial advice. It does not constitute a recommendation to buy or sell any stock, and does not take account of your objectives, or your financial situation. We aim to bring you long-term focused analysis driven by fundamental data. Note that our analysis may not factor in the latest price-sensitive company announcements or qualitative material. Simply Wall St has no position in any stocks mentioned.
About ASX:SGP
Stockland
We are a leading creator and curator of connected communities with people at the heart of the places we create.
Solid track record second-rate dividend payer.
Similar Companies
Market Insights


Advertisement
Community Narratives
Suncorp’s Next Chapter: Insurance-Only and Ready to Grow
Fair Value AU$22.83|4.9% undervalued
RO
Community Contributor
Thyssenkrupp Nucera Will Achieve Double-Digit Profits by 2030 Boosted by Hydrogen Growth
Fair Value €14.40|32.5% undervalued
CH
Community Contributor
Tesla’s Nvidia Moment – The AI & Robotics Inflection Point
Fair Value US$384.84|21.9% undervalued
BL
Community Contributor