Strong week for Mayne Pharma Group (ASX:MYX) shareholders doesn't alleviate pain of five-year loss


It's nice to see the Mayne Pharma Group Limited (ASX:MYX) share price up 11% in a week. But that doesn't change the fact that the returns over the last five years have been less than pleasing. You would have done a lot better buying an index fund, since the stock has dropped 55% in that half decade.
The recent uptick of 11% could be a positive sign of things to come, so let's take a look at historical fundamentals.
See our latest analysis for Mayne Pharma Group
Mayne Pharma Group wasn't profitable in the last twelve months, it is unlikely we'll see a strong correlation between its share price and its earnings per share (EPS). Arguably revenue is our next best option. Generally speaking, companies without profits are expected to grow revenue every year, and at a good clip. As you can imagine, fast revenue growth, when maintained, often leads to fast profit growth.
In the last five years Mayne Pharma Group saw its revenue shrink by 25% per year. That's definitely a weaker result than most pre-profit companies report. It seems appropriate, then, that the share price slid about 9% annually during that time. We don't generally like to own companies that lose money and don't grow revenues. You might be better off spending your money on a leisure activity. You'd want to research this company pretty thoroughly before buying, it looks a bit too risky for us.
The image below shows how earnings and revenue have tracked over time (if you click on the image you can see greater detail).
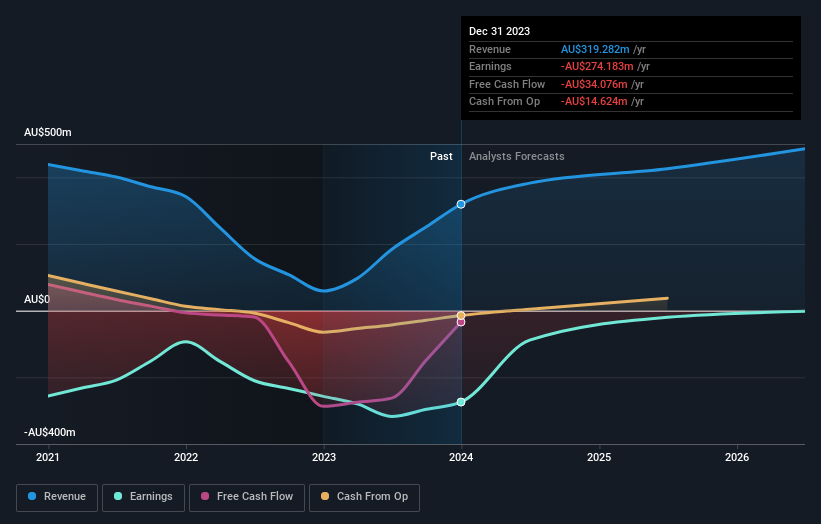
We consider it positive that insiders have made significant purchases in the last year. Even so, future earnings will be far more important to whether current shareholders make money. You can see what analysts are predicting for Mayne Pharma Group in this interactive graph of future profit estimates.
What About The Total Shareholder Return (TSR)?
Investors should note that there's a difference between Mayne Pharma Group's total shareholder return (TSR) and its share price change, which we've covered above. Arguably the TSR is a more complete return calculation because it accounts for the value of dividends (as if they were reinvested), along with the hypothetical value of any discounted capital that have been offered to shareholders. Mayne Pharma Group hasn't been paying dividends, but its TSR of -49% exceeds its share price return of -55%, implying it has either spun-off a business, or raised capital at a discount; thereby providing additional value to shareholders.
A Different Perspective
Investors in Mayne Pharma Group had a tough year, with a total loss of 3.4%, against a market gain of about 15%. However, keep in mind that even the best stocks will sometimes underperform the market over a twelve month period. However, the loss over the last year isn't as bad as the 8% per annum loss investors have suffered over the last half decade. We would want clear information suggesting the company will grow, before taking the view that the share price will stabilize. I find it very interesting to look at share price over the long term as a proxy for business performance. But to truly gain insight, we need to consider other information, too. Take risks, for example - Mayne Pharma Group has 1 warning sign we think you should be aware of.
There are plenty of other companies that have insiders buying up shares. You probably do not want to miss this free list of undervalued small cap companies that insiders are buying.
Please note, the market returns quoted in this article reflect the market weighted average returns of stocks that currently trade on Australian exchanges.
New: Manage All Your Stock Portfolios in One Place
We've created the ultimate portfolio companion for stock investors, and it's free.
• Connect an unlimited number of Portfolios and see your total in one currency
• Be alerted to new Warning Signs or Risks via email or mobile
• Track the Fair Value of your stocks
Have feedback on this article? Concerned about the content? Get in touch with us directly. Alternatively, email editorial-team (at) simplywallst.com.
This article by Simply Wall St is general in nature. We provide commentary based on historical data and analyst forecasts only using an unbiased methodology and our articles are not intended to be financial advice. It does not constitute a recommendation to buy or sell any stock, and does not take account of your objectives, or your financial situation. We aim to bring you long-term focused analysis driven by fundamental data. Note that our analysis may not factor in the latest price-sensitive company announcements or qualitative material. Simply Wall St has no position in any stocks mentioned.
Have feedback on this article? Concerned about the content? Get in touch with us directly. Alternatively, email editorial-team@simplywallst.com
About ASX:MYX
Mayne Pharma Group
A specialty pharmaceutical company, manufactures and sells branded and generic pharmaceutical products in Australia, New Zealand, the United States, Canada, Europe, Asia, and internationally.
Excellent balance sheet with reasonable growth potential.
Similar Companies
Market Insights

Community Narratives

