A Look At The Intrinsic Value Of Little Green Pharma Ltd (ASX:LGP)


Key Insights
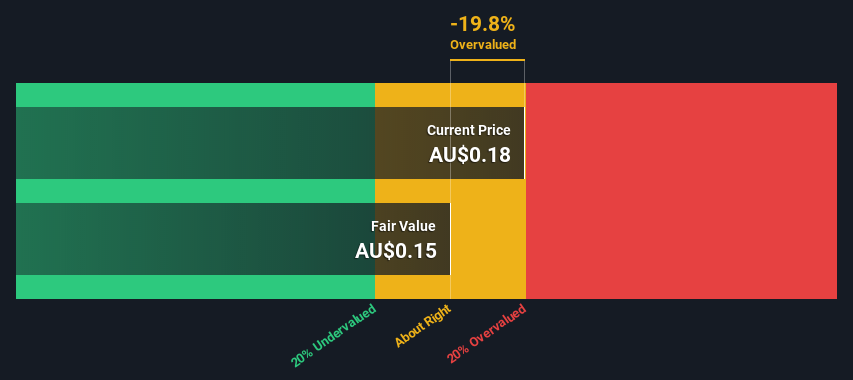
- Using the 2 Stage Free Cash Flow to Equity, Little Green Pharma fair value estimate is AU$0.15
- With AU$0.18 share price, Little Green Pharma appears to be trading close to its estimated fair value
- The average discount for Little Green Pharma's competitorsis currently 48%
Today we will run through one way of estimating the intrinsic value of Little Green Pharma Ltd (ASX:LGP) by projecting its future cash flows and then discounting them to today's value. This will be done using the Discounted Cash Flow (DCF) model. Believe it or not, it's not too difficult to follow, as you'll see from our example!
Remember though, that there are many ways to estimate a company's value, and a DCF is just one method. If you want to learn more about discounted cash flow, the rationale behind this calculation can be read in detail in the Simply Wall St analysis model.
View our latest analysis for Little Green Pharma
Crunching The Numbers
We use what is known as a 2-stage model, which simply means we have two different periods of growth rates for the company's cash flows. Generally the first stage is higher growth, and the second stage is a lower growth phase. To begin with, we have to get estimates of the next ten years of cash flows. Where possible we use analyst estimates, but when these aren't available we extrapolate the previous free cash flow (FCF) from the last estimate or reported value. We assume companies with shrinking free cash flow will slow their rate of shrinkage, and that companies with growing free cash flow will see their growth rate slow, over this period. We do this to reflect that growth tends to slow more in the early years than it does in later years.
Generally we assume that a dollar today is more valuable than a dollar in the future, so we discount the value of these future cash flows to their estimated value in today's dollars:
10-year free cash flow (FCF) forecast
| 2023 | 2024 | 2025 | 2026 | 2027 | 2028 | 2029 | 2030 | 2031 | 2032 | |
| Levered FCF (A$, Millions) | -AU$56.0m | -AU$6.20m | AU$2.00m | AU$2.88m | AU$3.78m | AU$4.63m | AU$5.38m | AU$6.03m | AU$6.57m | AU$7.03m |
| Growth Rate Estimate Source | Est @ 61.83% | Analyst x1 | Analyst x1 | Est @ 43.87% | Est @ 31.30% | Est @ 22.50% | Est @ 16.33% | Est @ 12.02% | Est @ 9.00% | Est @ 6.89% |
| Present Value (A$, Millions) Discounted @ 6.7% | -AU$52.5 | -AU$5.4 | AU$1.6 | AU$2.2 | AU$2.7 | AU$3.1 | AU$3.4 | AU$3.6 | AU$3.7 | AU$3.7 |
("Est" = FCF growth rate estimated by Simply Wall St)
Present Value of 10-year Cash Flow (PVCF) = -AU$34m
We now need to calculate the Terminal Value, which accounts for all the future cash flows after this ten year period. For a number of reasons a very conservative growth rate is used that cannot exceed that of a country's GDP growth. In this case we have used the 5-year average of the 10-year government bond yield (2.0%) to estimate future growth. In the same way as with the 10-year 'growth' period, we discount future cash flows to today's value, using a cost of equity of 6.7%.
Terminal Value (TV)= FCF2032 × (1 + g) ÷ (r – g) = AU$7.0m× (1 + 2.0%) ÷ (6.7%– 2.0%) = AU$151m
Present Value of Terminal Value (PVTV)= TV / (1 + r)10= AU$151m÷ ( 1 + 6.7%)10= AU$79m
The total value, or equity value, is then the sum of the present value of the future cash flows, which in this case is AU$45m. The last step is to then divide the equity value by the number of shares outstanding. Compared to the current share price of AU$0.2, the company appears around fair value at the time of writing. The assumptions in any calculation have a big impact on the valuation, so it is better to view this as a rough estimate, not precise down to the last cent.
The Assumptions
The calculation above is very dependent on two assumptions. The first is the discount rate and the other is the cash flows. You don't have to agree with these inputs, I recommend redoing the calculations yourself and playing with them. The DCF also does not consider the possible cyclicality of an industry, or a company's future capital requirements, so it does not give a full picture of a company's potential performance. Given that we are looking at Little Green Pharma as potential shareholders, the cost of equity is used as the discount rate, rather than the cost of capital (or weighted average cost of capital, WACC) which accounts for debt. In this calculation we've used 6.7%, which is based on a levered beta of 0.800. Beta is a measure of a stock's volatility, compared to the market as a whole. We get our beta from the industry average beta of globally comparable companies, with an imposed limit between 0.8 and 2.0, which is a reasonable range for a stable business.
SWOT Analysis for Little Green Pharma
- Debt is well covered by earnings.
- Shareholders have been diluted in the past year.
- Forecast to reduce losses next year.
- Good value based on P/S ratio compared to estimated Fair P/S ratio.
- Significant insider buying over the past 3 months.
- Debt is not well covered by operating cash flow.
Moving On:
Whilst important, the DCF calculation is only one of many factors that you need to assess for a company. It's not possible to obtain a foolproof valuation with a DCF model. Preferably you'd apply different cases and assumptions and see how they would impact the company's valuation. If a company grows at a different rate, or if its cost of equity or risk free rate changes sharply, the output can look very different. For Little Green Pharma, there are three relevant factors you should look at:
- Risks: For instance, we've identified 2 warning signs for Little Green Pharma that you should be aware of.
- Future Earnings: How does LGP's growth rate compare to its peers and the wider market? Dig deeper into the analyst consensus number for the upcoming years by interacting with our free analyst growth expectation chart.
- Other High Quality Alternatives: Do you like a good all-rounder? Explore our interactive list of high quality stocks to get an idea of what else is out there you may be missing!
PS. The Simply Wall St app conducts a discounted cash flow valuation for every stock on the ASX every day. If you want to find the calculation for other stocks just search here.
New: AI Stock Screener & Alerts
Our new AI Stock Screener scans the market every day to uncover opportunities.
• Dividend Powerhouses (3%+ Yield)
• Undervalued Small Caps with Insider Buying
• High growth Tech and AI Companies
Or build your own from over 50 metrics.
Have feedback on this article? Concerned about the content? Get in touch with us directly. Alternatively, email editorial-team (at) simplywallst.com.
This article by Simply Wall St is general in nature. We provide commentary based on historical data and analyst forecasts only using an unbiased methodology and our articles are not intended to be financial advice. It does not constitute a recommendation to buy or sell any stock, and does not take account of your objectives, or your financial situation. We aim to bring you long-term focused analysis driven by fundamental data. Note that our analysis may not factor in the latest price-sensitive company announcements or qualitative material. Simply Wall St has no position in any stocks mentioned.
About ASX:LGP
Little Green Pharma
Engages in the cultivation, production, and distribution of medicinal cannabis products in Australia and internationally.
Flawless balance sheet and undervalued.
Market Insights

Community Narratives

