IncentiaPay Limited (ASX:INP) Shares Fly 50% But Investors Aren't Buying For Growth


IncentiaPay Limited (ASX:INP) shares have had a really impressive month, gaining 50% after a shaky period beforehand. Longer-term shareholders would be thankful for the recovery in the share price since it's now virtually flat for the year after the recent bounce.
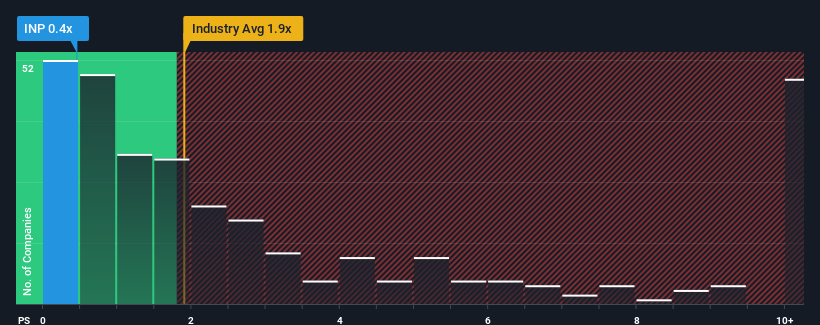
Even after such a large jump in price, IncentiaPay may still be sending very bullish signals at the moment with its price-to-sales (or "P/S") ratio of 0.4x, since almost half of all companies in the Interactive Media and Services industry in Australia have P/S ratios greater than 2.6x and even P/S higher than 7x are not unusual. However, the P/S might be quite low for a reason and it requires further investigation to determine if it's justified.
Check out our latest analysis for IncentiaPay
What Does IncentiaPay's P/S Mean For Shareholders?
As an illustration, revenue has deteriorated at IncentiaPay over the last year, which is not ideal at all. It might be that many expect the disappointing revenue performance to continue or accelerate, which has repressed the P/S. However, if this doesn't eventuate then existing shareholders may be feeling optimistic about the future direction of the share price.
Although there are no analyst estimates available for IncentiaPay, take a look at this free data-rich visualisation to see how the company stacks up on earnings, revenue and cash flow.How Is IncentiaPay's Revenue Growth Trending?
In order to justify its P/S ratio, IncentiaPay would need to produce anemic growth that's substantially trailing the industry.
Retrospectively, the last year delivered a frustrating 13% decrease to the company's top line. As a result, revenue from three years ago have also fallen 45% overall. So unfortunately, we have to acknowledge that the company has not done a great job of growing revenue over that time.
Comparing that to the industry, which is predicted to deliver 6.3% growth in the next 12 months, the company's downward momentum based on recent medium-term revenue results is a sobering picture.
With this information, we are not surprised that IncentiaPay is trading at a P/S lower than the industry. Nonetheless, there's no guarantee the P/S has reached a floor yet with revenue going in reverse. Even just maintaining these prices could be difficult to achieve as recent revenue trends are already weighing down the shares.
What Does IncentiaPay's P/S Mean For Investors?
Even after such a strong price move, IncentiaPay's P/S still trails the rest of the industry. Typically, we'd caution against reading too much into price-to-sales ratios when settling on investment decisions, though it can reveal plenty about what other market participants think about the company.
It's no surprise that IncentiaPay maintains its low P/S off the back of its sliding revenue over the medium-term. At this stage investors feel the potential for an improvement in revenue isn't great enough to justify a higher P/S ratio. Given the current circumstances, it seems unlikely that the share price will experience any significant movement in either direction in the near future if recent medium-term revenue trends persist.
It is also worth noting that we have found 4 warning signs for IncentiaPay that you need to take into consideration.
If you're unsure about the strength of IncentiaPay's business, why not explore our interactive list of stocks with solid business fundamentals for some other companies you may have missed.
Valuation is complex, but we're here to simplify it.
Discover if Entertainment Rewards might be undervalued or overvalued with our detailed analysis, featuring fair value estimates, potential risks, dividends, insider trades, and its financial condition.
Access Free AnalysisHave feedback on this article? Concerned about the content? Get in touch with us directly. Alternatively, email editorial-team (at) simplywallst.com.
This article by Simply Wall St is general in nature. We provide commentary based on historical data and analyst forecasts only using an unbiased methodology and our articles are not intended to be financial advice. It does not constitute a recommendation to buy or sell any stock, and does not take account of your objectives, or your financial situation. We aim to bring you long-term focused analysis driven by fundamental data. Note that our analysis may not factor in the latest price-sensitive company announcements or qualitative material. Simply Wall St has no position in any stocks mentioned.
About ASX:EAT
Entertainment Rewards
Engages in the operation of an entertainment, lifestyles, and rewards platform in Australia and New Zealand.
Low and slightly overvalued.
