Advertisement
- Australia
- /
- Metals and Mining
- /
- ASX:PRN
3 ASX Penny Stocks With Market Caps Over A$20M To Consider

Simply Wall St
Reviewed by Simply Wall St

The Australian share market is showing signs of stabilization, with futures indicating a modest rise as traders assess the broader implications of recent global developments. Amidst these conditions, penny stocks—though an old term—remain a relevant area for investors seeking potential growth opportunities. These smaller or newer companies can offer affordability and growth potential, especially when they are backed by solid financials.
Top 10 Penny Stocks In Australia
| Name | Share Price | Market Cap | Rewards & Risks |
| Lindsay Australia (ASX:LAU) | A$0.70 | A$222.02M | ✅ 4 ⚠️ 2 View Analysis > |
| CTI Logistics (ASX:CLX) | A$1.835 | A$147.8M | ✅ 4 ⚠️ 2 View Analysis > |
| Accent Group (ASX:AX1) | A$1.86 | A$1.12B | ✅ 4 ⚠️ 2 View Analysis > |
| EZZ Life Science Holdings (ASX:EZZ) | A$1.57 | A$74.06M | ✅ 4 ⚠️ 2 View Analysis > |
| IVE Group (ASX:IGL) | A$2.57 | A$396.25M | ✅ 4 ⚠️ 2 View Analysis > |
| GTN (ASX:GTN) | A$0.60 | A$114.54M | ✅ 3 ⚠️ 2 View Analysis > |
| Bisalloy Steel Group (ASX:BIS) | A$3.59 | A$170.35M | ✅ 3 ⚠️ 1 View Analysis > |
| Regal Partners (ASX:RPL) | A$2.13 | A$716.03M | ✅ 4 ⚠️ 3 View Analysis > |
| Navigator Global Investments (ASX:NGI) | A$1.70 | A$833.14M | ✅ 5 ⚠️ 3 View Analysis > |
| Tasmea (ASX:TEA) | A$2.88 | A$674.03M | ✅ 4 ⚠️ 2 View Analysis > |
Click here to see the full list of 998 stocks from our ASX Penny Stocks screener.
Let's take a closer look at a couple of our picks from the screened companies.
Hawsons Iron (ASX:HIO)
Simply Wall St Financial Health Rating: ★★★★☆☆
Overview: Hawsons Iron Limited is involved in mineral exploration activities in Australia and has a market capitalization of A$28.46 million.
Operations: No revenue segments are reported for this company.
Market Cap: A$28.46M
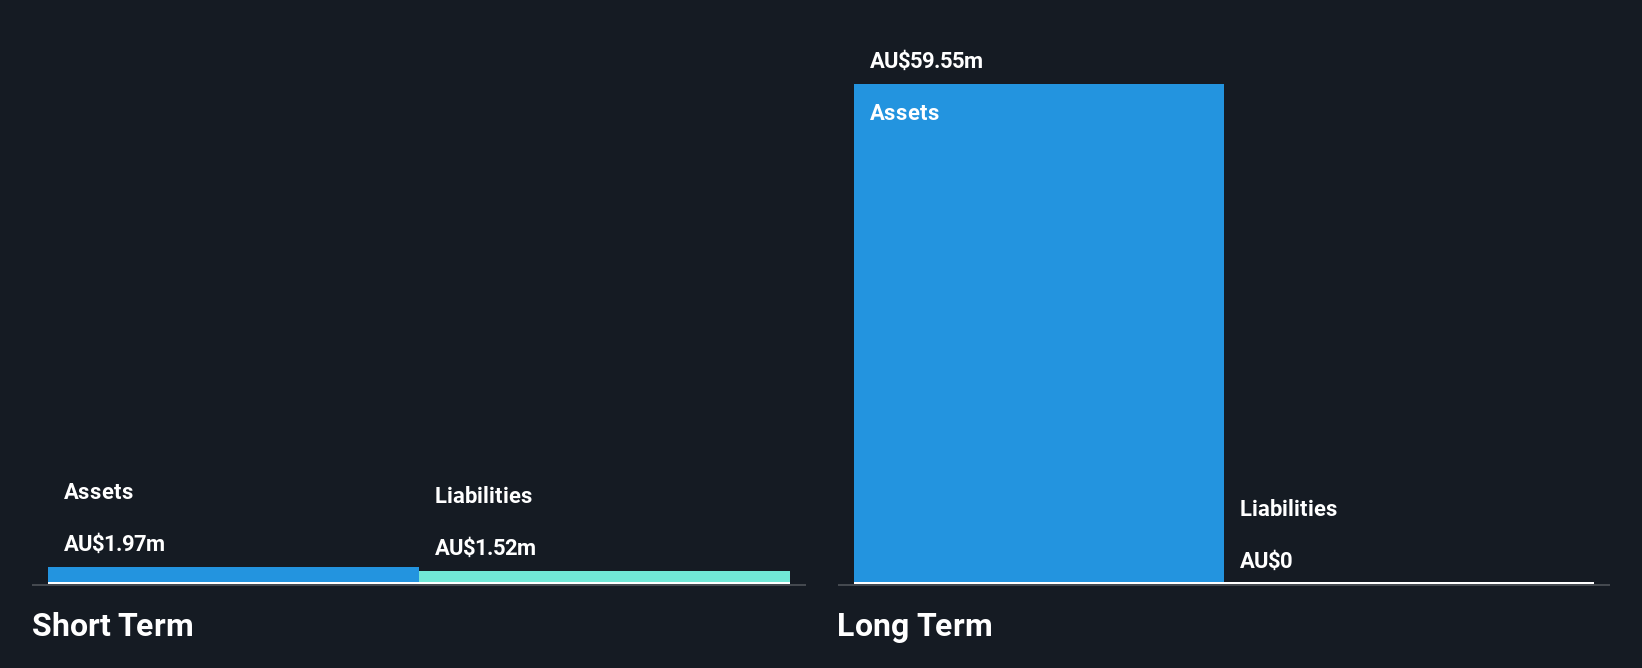
Hawsons Iron Limited, with a market cap of A$28.46 million, is currently pre-revenue and unprofitable but has reduced its losses over the past five years by 4.3% annually. The company is debt-free and its short-term assets of A$2 million exceed its short-term liabilities of A$1.5 million, indicating a stable financial position despite having less than a year of cash runway if cash flow trends continue. Its board is considered experienced with an average tenure of 3.3 years, though management experience data is insufficient. The stock has shown increased volatility recently and remains highly volatile over the past three months without significant shareholder dilution in the last year.
- Dive into the specifics of Hawsons Iron here with our thorough balance sheet health report.
- Assess Hawsons Iron's previous results with our detailed historical performance reports.
Perenti (ASX:PRN)
Simply Wall St Financial Health Rating: ★★★★★★
Overview: Perenti Limited is a global mining services company with a market capitalization of A$1.45 billion.
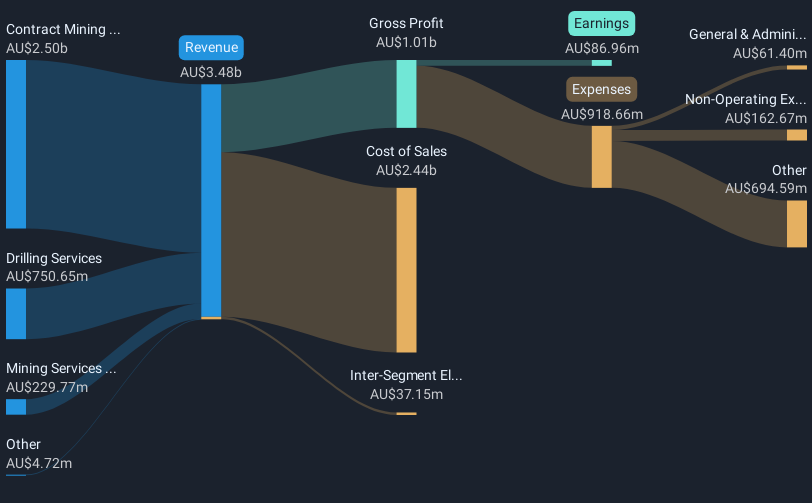
Operations: Perenti generates revenue through its Drilling Services (A$750.65 million), Contract Mining Services (A$2.50 billion), and Mining Services and Idoba (A$229.77 million) segments.
Market Cap: A$1.45B
Perenti Limited, with a market cap of A$1.45 billion, is not pre-revenue and has diverse revenue streams from its Drilling Services (A$750.65 million), Contract Mining Services (A$2.50 billion), and Mining Services and Idoba (A$229.77 million) segments. Despite a decline in profit margins to 2.5% from 3.9% last year, the company maintains stable weekly volatility at 5%. Its debt is well covered by operating cash flow at 57%, and short-term assets exceed both long-term liabilities and short-term liabilities significantly, suggesting financial robustness amidst low return on equity of 5.6%.
- Take a closer look at Perenti's potential here in our financial health report.
- Review our growth performance report to gain insights into Perenti's future.
Zeotech (ASX:ZEO)
Simply Wall St Financial Health Rating: ★★★★★☆
Overview: Zeotech Limited is involved in the exploration and evaluation of mineral properties in Australia, with a market cap of A$161.69 million.
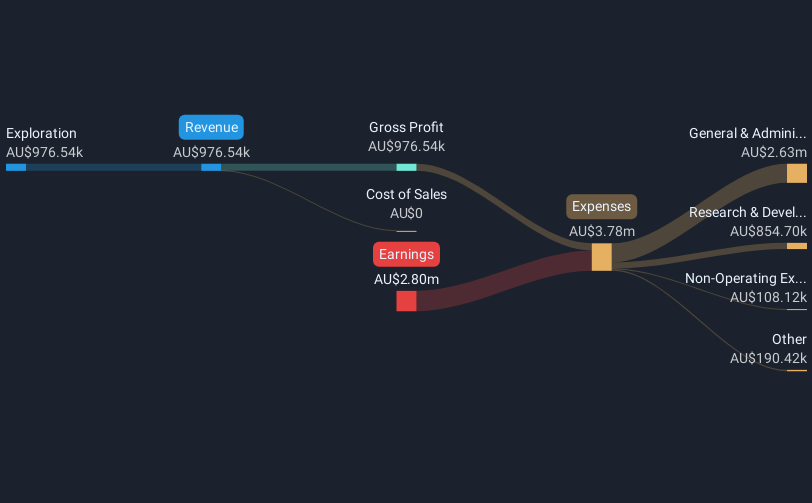
Operations: The company's revenue segment consists solely of exploration, generating A$0.98 million.
Market Cap: A$161.69M
Zeotech Limited, with a market cap of A$161.69 million, is pre-revenue, generating A$0.98 million solely from exploration activities. The company remains debt-free and has more short-term assets than liabilities, indicating a solid financial position despite its unprofitability and negative return on equity of -22.7%. Recent executive changes include the appointment of Shane Graham as Executive Director (Technical), bringing extensive experience in building materials and construction technology. Zeotech's cash runway is less than a year if free cash flow continues to decrease at historical rates but extends beyond a year if stabilized.
- Navigate through the intricacies of Zeotech with our comprehensive balance sheet health report here.
- Explore historical data to track Zeotech's performance over time in our past results report.
Key Takeaways
- Unlock our comprehensive list of 998 ASX Penny Stocks by clicking here.
- Want To Explore Some Alternatives? AI is about to change healthcare. These 22 stocks are working on everything from early diagnostics to drug discovery. The best part - they are all under $10b in market cap - there's still time to get in early.
This article by Simply Wall St is general in nature. We provide commentary based on historical data and analyst forecasts only using an unbiased methodology and our articles are not intended to be financial advice. It does not constitute a recommendation to buy or sell any stock, and does not take account of your objectives, or your financial situation. We aim to bring you long-term focused analysis driven by fundamental data. Note that our analysis may not factor in the latest price-sensitive company announcements or qualitative material. Simply Wall St has no position in any stocks mentioned.
New: Manage All Your Stock Portfolios in One Place
We've created the ultimate portfolio companion for stock investors, and it's free.
• Connect an unlimited number of Portfolios and see your total in one currency
• Be alerted to new Warning Signs or Risks via email or mobile
• Track the Fair Value of your stocks
Have feedback on this article? Concerned about the content? Get in touch with us directly. Alternatively, email editorial-team@simplywallst.com
About ASX:PRN
Flawless balance sheet average dividend payer.
Similar Companies
Market Insights

Advertisement
Community Narratives
MicroStrategy: Volatile Gamble or Golden Opportunity?
Fair Value US$663.00|36.2% undervalued
BL
Community Contributor
Emerging Markets and Debt Reduction Will Propel Bath & Body Works Forward
Fair Value US$40.73|22.0% undervalued
ZW
Community Contributor
An amazing opportunity to potentially get a 100 bagger
Fair Value US$10.00|46.4% overvalued
DA
Community Contributor