
Advertisement
Has SciDev Limited's (ASX:SDV) Impressive Stock Performance Got Anything to Do With Its Fundamentals?

Most readers would already be aware that SciDev's (ASX:SDV) stock increased significantly by 45% over the past three months. We wonder if and what role the company's financials play in that price change as a company's long-term fundamentals usually dictate market outcomes. Specifically, we decided to study SciDev's ROE in this article.
ROE or return on equity is a useful tool to assess how effectively a company can generate returns on the investment it received from its shareholders. Put another way, it reveals the company's success at turning shareholder investments into profits.
View our latest analysis for SciDev
How Is ROE Calculated?
Return on equity can be calculated by using the formula:
Return on Equity = Net Profit (from continuing operations) ÷ Shareholders' Equity
So, based on the above formula, the ROE for SciDev is:
4.3% = AU$2.2m ÷ AU$50m (Based on the trailing twelve months to June 2024).
The 'return' is the profit over the last twelve months. One way to conceptualize this is that for each A$1 of shareholders' capital it has, the company made A$0.04 in profit.
What Has ROE Got To Do With Earnings Growth?
We have already established that ROE serves as an efficient profit-generating gauge for a company's future earnings. Depending on how much of these profits the company reinvests or "retains", and how effectively it does so, we are then able to assess a company’s earnings growth potential. Assuming everything else remains unchanged, the higher the ROE and profit retention, the higher the growth rate of a company compared to companies that don't necessarily bear these characteristics.
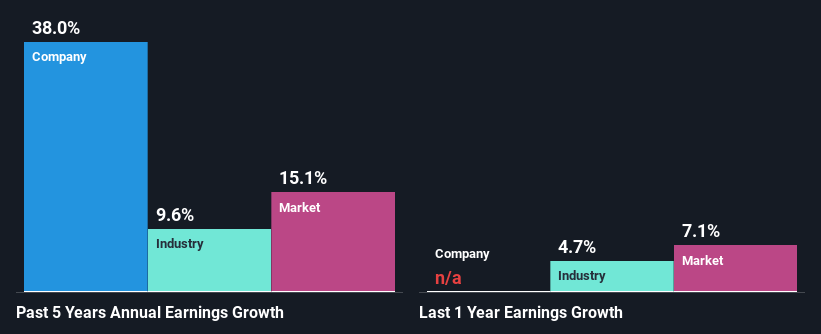
A Side By Side comparison of SciDev's Earnings Growth And 4.3% ROE
It is hard to argue that SciDev's ROE is much good in and of itself. Even when compared to the industry average of 7.8%, the ROE figure is pretty disappointing. Despite this, surprisingly, SciDev saw an exceptional 38% net income growth over the past five years. Therefore, there could be other reasons behind this growth. For instance, the company has a low payout ratio or is being managed efficiently.
Next, on comparing with the industry net income growth, we found that SciDev's growth is quite high when compared to the industry average growth of 9.6% in the same period, which is great to see.
Earnings growth is an important metric to consider when valuing a stock. What investors need to determine next is if the expected earnings growth, or the lack of it, is already built into the share price. This then helps them determine if the stock is placed for a bright or bleak future. One good indicator of expected earnings growth is the P/E ratio which determines the price the market is willing to pay for a stock based on its earnings prospects. So, you may want to check if SciDev is trading on a high P/E or a low P/E, relative to its industry.
Is SciDev Making Efficient Use Of Its Profits?
SciDev doesn't pay any regular dividends currently which essentially means that it has been reinvesting all of its profits into the business. This definitely contributes to the high earnings growth number that we discussed above.
Summary
Overall, we feel that SciDev certainly does have some positive factors to consider. Despite its low rate of return, the fact that the company reinvests a very high portion of its profits into its business, no doubt contributed to its high earnings growth. With that said, the latest industry analyst forecasts reveal that the company's earnings are expected to accelerate. To know more about the company's future earnings growth forecasts take a look at this free report on analyst forecasts for the company to find out more.
New: Manage All Your Stock Portfolios in One Place
We've created the ultimate portfolio companion for stock investors, and it's free.
• Connect an unlimited number of Portfolios and see your total in one currency
• Be alerted to new Warning Signs or Risks via email or mobile
• Track the Fair Value of your stocks
Have feedback on this article? Concerned about the content? Get in touch with us directly. Alternatively, email editorial-team (at) simplywallst.com.
This article by Simply Wall St is general in nature. We provide commentary based on historical data and analyst forecasts only using an unbiased methodology and our articles are not intended to be financial advice. It does not constitute a recommendation to buy or sell any stock, and does not take account of your objectives, or your financial situation. We aim to bring you long-term focused analysis driven by fundamental data. Note that our analysis may not factor in the latest price-sensitive company announcements or qualitative material. Simply Wall St has no position in any stocks mentioned.
About ASX:SDV
SciDev
Provides environmental solutions focused on water intensive industries in Australia, the United States, Asia, and internationally.
Excellent balance sheet with reasonable growth potential.
Similar Companies
Market Insights


Advertisement
Community Narratives
Nike's Direct-to-Consumer Focus Will Drive Future Growth
Fair Value US$87.90|18.2% undervalued
UN
Community Contributor
Novo Nordisk will dominate GLP-1 market with Ozempic and Wegovy growth
Fair Value US$89.59|12.1% undervalued
BE
Community Contributor
Rheinmetall could get 20-25% of EU-NATO 3%-GDP defence spending
Fair Value €7.57k|82.4% undervalued
NO
Community Contributor