
Advertisement
David Iben put it well when he said, 'Volatility is not a risk we care about. What we care about is avoiding the permanent loss of capital.' So it seems the smart money knows that debt - which is usually involved in bankruptcies - is a very important factor, when you assess how risky a company is. We can see that Red 5 Limited (ASX:RED) does use debt in its business. But should shareholders be worried about its use of debt?
When Is Debt A Problem?
Debt is a tool to help businesses grow, but if a business is incapable of paying off its lenders, then it exists at their mercy. Part and parcel of capitalism is the process of 'creative destruction' where failed businesses are mercilessly liquidated by their bankers. However, a more frequent (but still costly) occurrence is where a company must issue shares at bargain-basement prices, permanently diluting shareholders, just to shore up its balance sheet. Of course, debt can be an important tool in businesses, particularly capital heavy businesses. The first thing to do when considering how much debt a business uses is to look at its cash and debt together.
View our latest analysis for Red 5
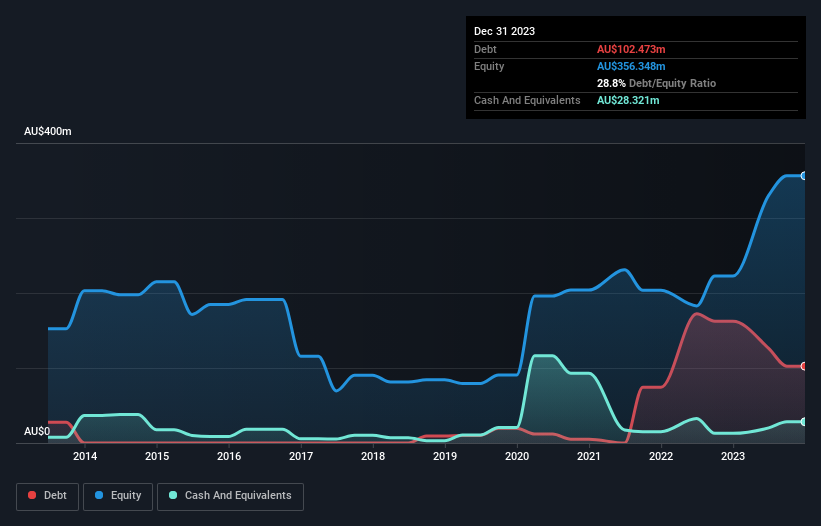
What Is Red 5's Net Debt?
The image below, which you can click on for greater detail, shows that Red 5 had debt of AU$102.5m at the end of December 2023, a reduction from AU$162.4m over a year. However, it also had AU$28.3m in cash, and so its net debt is AU$74.2m.
A Look At Red 5's Liabilities
We can see from the most recent balance sheet that Red 5 had liabilities of AU$132.5m falling due within a year, and liabilities of AU$179.8m due beyond that. Offsetting these obligations, it had cash of AU$28.3m as well as receivables valued at AU$12.3m due within 12 months. So its liabilities total AU$271.7m more than the combination of its cash and short-term receivables.
Since publicly traded Red 5 shares are worth a total of AU$1.49b, it seems unlikely that this level of liabilities would be a major threat. However, we do think it is worth keeping an eye on its balance sheet strength, as it may change over time.
We measure a company's debt load relative to its earnings power by looking at its net debt divided by its earnings before interest, tax, depreciation, and amortization (EBITDA) and by calculating how easily its earnings before interest and tax (EBIT) cover its interest expense (interest cover). The advantage of this approach is that we take into account both the absolute quantum of debt (with net debt to EBITDA) and the actual interest expenses associated with that debt (with its interest cover ratio).
Looking at its net debt to EBITDA of 0.50 and interest cover of 3.5 times, it seems to us that Red 5 is probably using debt in a pretty reasonable way. But the interest payments are certainly sufficient to have us thinking about how affordable its debt is. Notably, Red 5 made a loss at the EBIT level, last year, but improved that to positive EBIT of AU$67m in the last twelve months. There's no doubt that we learn most about debt from the balance sheet. But ultimately the future profitability of the business will decide if Red 5 can strengthen its balance sheet over time. So if you're focused on the future you can check out this free report showing analyst profit forecasts.
Finally, a business needs free cash flow to pay off debt; accounting profits just don't cut it. So it is important to check how much of its earnings before interest and tax (EBIT) converts to actual free cash flow. Happily for any shareholders, Red 5 actually produced more free cash flow than EBIT over the last year. That sort of strong cash generation warms our hearts like a puppy in a bumblebee suit.
Our View
Happily, Red 5's impressive conversion of EBIT to free cash flow implies it has the upper hand on its debt. But truth be told we feel its interest cover does undermine this impression a bit. Looking at all the aforementioned factors together, it strikes us that Red 5 can handle its debt fairly comfortably. On the plus side, this leverage can boost shareholder returns, but the potential downside is more risk of loss, so it's worth monitoring the balance sheet. Over time, share prices tend to follow earnings per share, so if you're interested in Red 5, you may well want to click here to check an interactive graph of its earnings per share history.
If you're interested in investing in businesses that can grow profits without the burden of debt, then check out this free list of growing businesses that have net cash on the balance sheet.
New: Manage All Your Stock Portfolios in One Place
We've created the ultimate portfolio companion for stock investors, and it's free.
• Connect an unlimited number of Portfolios and see your total in one currency
• Be alerted to new Warning Signs or Risks via email or mobile
• Track the Fair Value of your stocks
Have feedback on this article? Concerned about the content? Get in touch with us directly. Alternatively, email editorial-team (at) simplywallst.com.
This article by Simply Wall St is general in nature. We provide commentary based on historical data and analyst forecasts only using an unbiased methodology and our articles are not intended to be financial advice. It does not constitute a recommendation to buy or sell any stock, and does not take account of your objectives, or your financial situation. We aim to bring you long-term focused analysis driven by fundamental data. Note that our analysis may not factor in the latest price-sensitive company announcements or qualitative material. Simply Wall St has no position in any stocks mentioned.
About ASX:VAU
Vault Minerals
Engages in the exploration, mine development, mine operations and the sale of gold and gold/copper concentrate in Australia and Canada.
Flawless balance sheet and fair value.
Similar Companies
Market Insights

Advertisement
Community Narratives
Kodiak AI - a potential 100 bagger opportunity?
Fair Value US$14.00|44.7% undervalued
DA
Community Contributor
A Fair Price for a Great Business Facing Real Threats
Fair Value US$383.06|13.0% undervalued
IM
Community Contributor
AXON And Shopify Integration Will Unlock Global Mobile Advertising
Fair Value US$646.30|0% overvalued
AN
Based on Analyst Price Targets