
Advertisement
- Australia
- /
- Paper and Forestry Products
- /
- ASX:MWY
Midway (ASX:MWY) shareholders are up 11% this past week, but still in the red over the last five years

Midway Limited (ASX:MWY) shareholders should be happy to see the share price up 11% in the last week. But that is little comfort to those holding over the last half decade, sitting on a big loss. In fact, the share price has declined rather badly, down some 61% in that time. So we're not so sure if the recent bounce should be celebrated. Of course, this could be the start of a turnaround.
Although the past week has been more reassuring for shareholders, they're still in the red over the last five years, so let's see if the underlying business has been responsible for the decline.
Check out our latest analysis for Midway
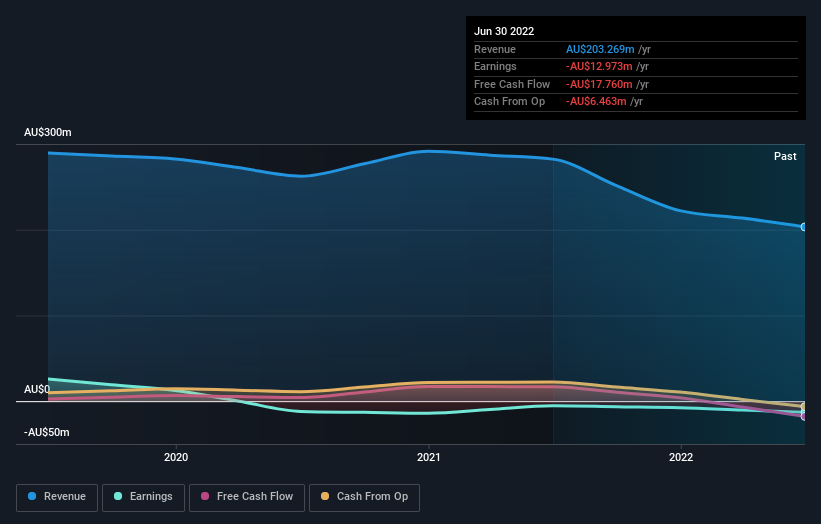
Midway isn't currently profitable, so most analysts would look to revenue growth to get an idea of how fast the underlying business is growing. Shareholders of unprofitable companies usually expect strong revenue growth. Some companies are willing to postpone profitability to grow revenue faster, but in that case one does expect good top-line growth.
In the last half decade, Midway saw its revenue increase by 1.2% per year. That's not a very high growth rate considering it doesn't make profits. It's likely this weak growth has contributed to an annualised return of 10% for the last five years. We'd want to see proof that future revenue growth is likely to be significantly stronger before getting too interested in Midway. When a stock falls hard like this, some investors like to add the company to a watchlist (in case the business recovers, longer term).
You can see below how earnings and revenue have changed over time (discover the exact values by clicking on the image).
This free interactive report on Midway's balance sheet strength is a great place to start, if you want to investigate the stock further.
What About The Total Shareholder Return (TSR)?
We'd be remiss not to mention the difference between Midway's total shareholder return (TSR) and its share price return. Arguably the TSR is a more complete return calculation because it accounts for the value of dividends (as if they were reinvested), along with the hypothetical value of any discounted capital that have been offered to shareholders. Its history of dividend payouts mean that Midway's TSR, which was a 56% drop over the last 5 years, was not as bad as the share price return.
A Different Perspective
Investors in Midway had a tough year, with a total loss of 23%, against a market gain of about 4.5%. Even the share prices of good stocks drop sometimes, but we want to see improvements in the fundamental metrics of a business, before getting too interested. Unfortunately, last year's performance may indicate unresolved challenges, given that it was worse than the annualised loss of 9% over the last half decade. We realise that Baron Rothschild has said investors should "buy when there is blood on the streets", but we caution that investors should first be sure they are buying a high quality business. I find it very interesting to look at share price over the long term as a proxy for business performance. But to truly gain insight, we need to consider other information, too. Take risks, for example - Midway has 2 warning signs (and 1 which shouldn't be ignored) we think you should know about.
For those who like to find winning investments this free list of growing companies with recent insider purchasing, could be just the ticket.
Please note, the market returns quoted in this article reflect the market weighted average returns of stocks that currently trade on AU exchanges.
New: Manage All Your Stock Portfolios in One Place
We've created the ultimate portfolio companion for stock investors, and it's free.
• Connect an unlimited number of Portfolios and see your total in one currency
• Be alerted to new Warning Signs or Risks via email or mobile
• Track the Fair Value of your stocks
Have feedback on this article? Concerned about the content? Get in touch with us directly. Alternatively, email editorial-team (at) simplywallst.com.
This article by Simply Wall St is general in nature. We provide commentary based on historical data and analyst forecasts only using an unbiased methodology and our articles are not intended to be financial advice. It does not constitute a recommendation to buy or sell any stock, and does not take account of your objectives, or your financial situation. We aim to bring you long-term focused analysis driven by fundamental data. Note that our analysis may not factor in the latest price-sensitive company announcements or qualitative material. Simply Wall St has no position in any stocks mentioned.
About ASX:MWY
Midway
Engages in the production, processing, marketing, and export of woodfibre in Australia, China, Japan, and Southeast Asia.
Flawless balance sheet low.
Market Insights

Advertisement
Community Narratives
Groundbreaking therapies that could change the treatment landscape for PTSD, fibromyalgia, MS & Alzheimer’s
Fair Value US$6.20|82.7% undervalued
CM
Community Contributor
DigitalOcean Will Grow 14% by Embracing AI with Paperspace Acquisition
Fair Value US$50.00|36.8% undervalued
NE
Community Contributor
Viant Technology: A Rising AdTech Challenger in the AI-Powered CTV Market
Fair Value US$38.61|61.4% undervalued
BL
Community Contributor
Volvo will Accelerate Forward into Electric and Autonomous Leadership in Five Years
Fair Value SEK 438.80|37.1% undervalued
UN
Community Contributor