Advertisement
- Australia
- /
- Metals and Mining
- /
- ASX:KCN
ASX Penny Stock Highlights For October 2025

Simply Wall St
Reviewed by Simply Wall St
Australian shares are poised for a modest rise as trading resumes in New South Wales and Queensland, with the ASX 200 futures indicating a slight gain. Amidst global market movements, particularly the bullish run on Wall Street driven by AI developments, Australian investors continue to explore diverse opportunities. Penny stocks, often representing smaller or emerging companies, remain an intriguing area of investment; despite their historical connotations, they offer potential value when backed by strong financials and growth prospects.
Top 10 Penny Stocks In Australia
| Name | Share Price | Market Cap | Rewards & Risks |
| Alfabs Australia (ASX:AAL) | A$0.475 | A$136.13M | ✅ 4 ⚠️ 3 View Analysis > |
| EZZ Life Science Holdings (ASX:EZZ) | A$2.53 | A$119.35M | ✅ 2 ⚠️ 2 View Analysis > |
| Dusk Group (ASX:DSK) | A$0.82 | A$51.06M | ✅ 4 ⚠️ 2 View Analysis > |
| IVE Group (ASX:IGL) | A$2.71 | A$417.24M | ✅ 4 ⚠️ 3 View Analysis > |
| MotorCycle Holdings (ASX:MTO) | A$3.30 | A$243.56M | ✅ 4 ⚠️ 2 View Analysis > |
| Pureprofile (ASX:PPL) | A$0.042 | A$49.13M | ✅ 3 ⚠️ 1 View Analysis > |
| West African Resources (ASX:WAF) | A$3.04 | A$3.47B | ✅ 4 ⚠️ 1 View Analysis > |
| Count (ASX:CUP) | A$1.05 | A$174.9M | ✅ 4 ⚠️ 1 View Analysis > |
| Praemium (ASX:PPS) | A$0.75 | A$358.29M | ✅ 5 ⚠️ 2 View Analysis > |
| Service Stream (ASX:SSM) | A$2.27 | A$1.39B | ✅ 3 ⚠️ 1 View Analysis > |
Click here to see the full list of 423 stocks from our ASX Penny Stocks screener.
Underneath we present a selection of stocks filtered out by our screen.
Jupiter Mines (ASX:JMS)
Simply Wall St Financial Health Rating: ★★★★★★
Overview: Jupiter Mines Limited is an independent mining company based in Australia with a market cap of A$540.32 million.
Operations: The company generates revenue from its manganese operations in South Africa, totaling A$9.43 million.
Market Cap: A$540.32M
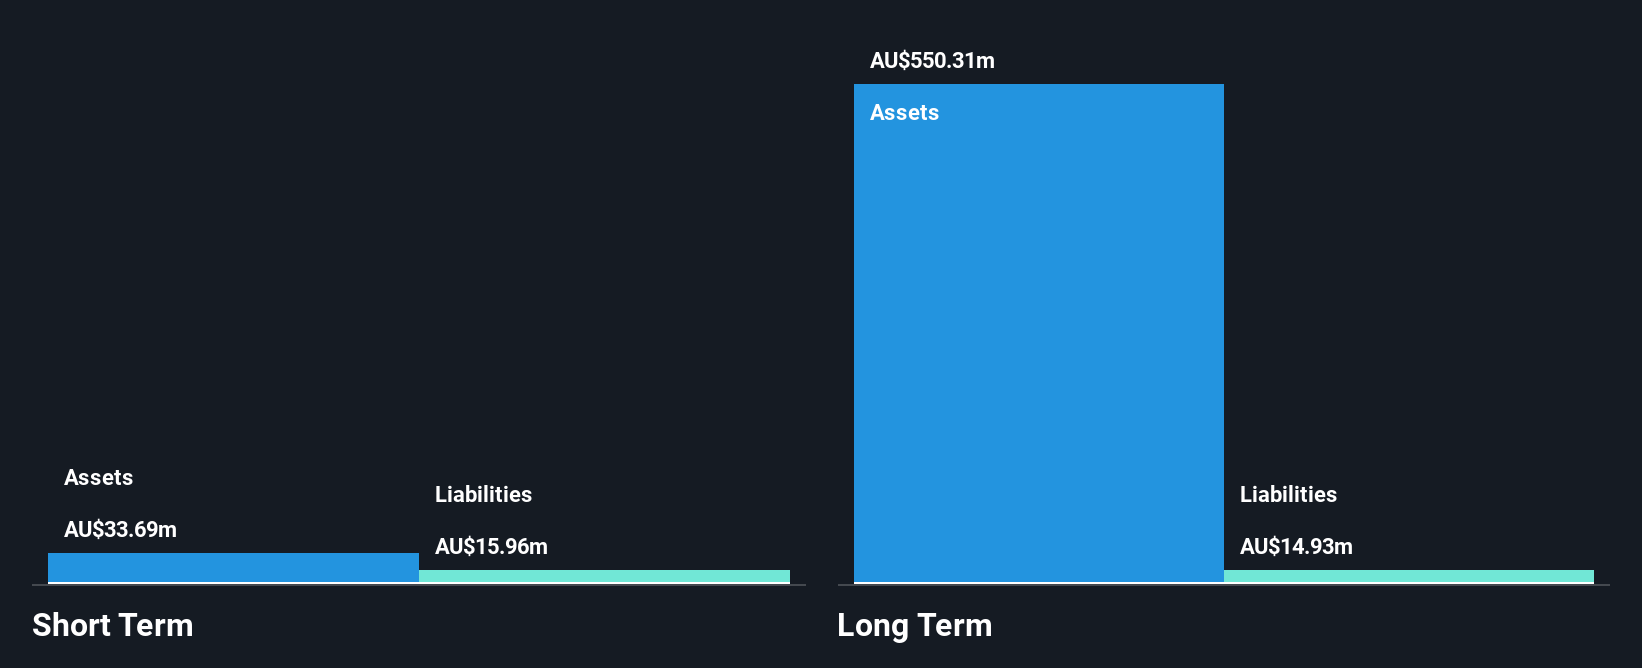
Jupiter Mines, with a market cap of A$540.32 million, recently reported earnings of A$40.09 million for the year ending June 2025, up from A$38.87 million the previous year, alongside sales of A$9.43 million. The company is debt-free and has short-term assets exceeding both its long-term and short-term liabilities, indicating solid financial health despite its low return on equity of 7.1%. However, earnings growth remains modest compared to industry standards and past performance shows a decline over five years at -9.9% annually. The dividend yield is high but not well-covered by free cash flows.
- Click here to discover the nuances of Jupiter Mines with our detailed analytical financial health report.
- Evaluate Jupiter Mines' historical performance by accessing our past performance report.
Kingsgate Consolidated (ASX:KCN)
Simply Wall St Financial Health Rating: ★★★★☆☆
Overview: Kingsgate Consolidated Limited is involved in the exploration, development, and mining of mineral properties with a market cap of A$1.03 billion.
Operations: The company generates revenue from its Chatree segment, which amounted to A$336.75 million.
Market Cap: A$1.03B
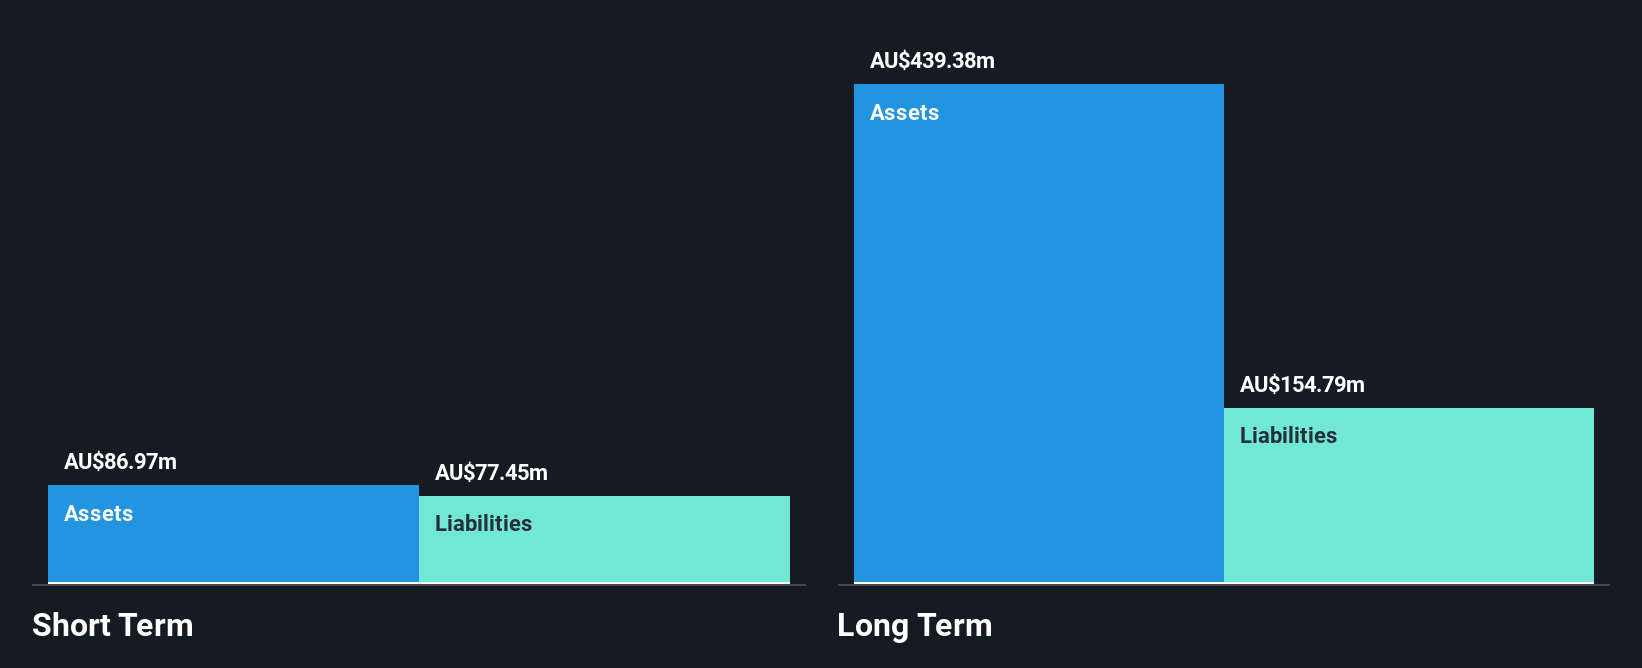
Kingsgate Consolidated, with a market cap of A$1.03 billion, has shown mixed financial performance. While its short-term assets of A$104.5 million exceed short-term liabilities of A$81.3 million, long-term liabilities remain uncovered by these assets. The company's debt is well-covered by operating cash flow and its net debt to equity ratio is satisfactory at 12.5%. However, recent earnings declined significantly despite revenue growth to A$336.75 million from the Chatree segment; net income dropped to A$29.46 million from the previous year's very large figure due to lower profit margins and negative earnings growth over the past year.
- Navigate through the intricacies of Kingsgate Consolidated with our comprehensive balance sheet health report here.
- Learn about Kingsgate Consolidated's future growth trajectory here.
Web Travel Group (ASX:WEB)
Simply Wall St Financial Health Rating: ★★★★★☆
Overview: Web Travel Group Limited offers online travel booking services across Australia, the United Arab Emirates, the United Kingdom, and other international markets, with a market cap of A$1.51 billion.
Operations: The company's revenue is primarily generated from its Business to Business Travel (B2B) segment, which accounts for A$328.4 million.
Market Cap: A$1.51B
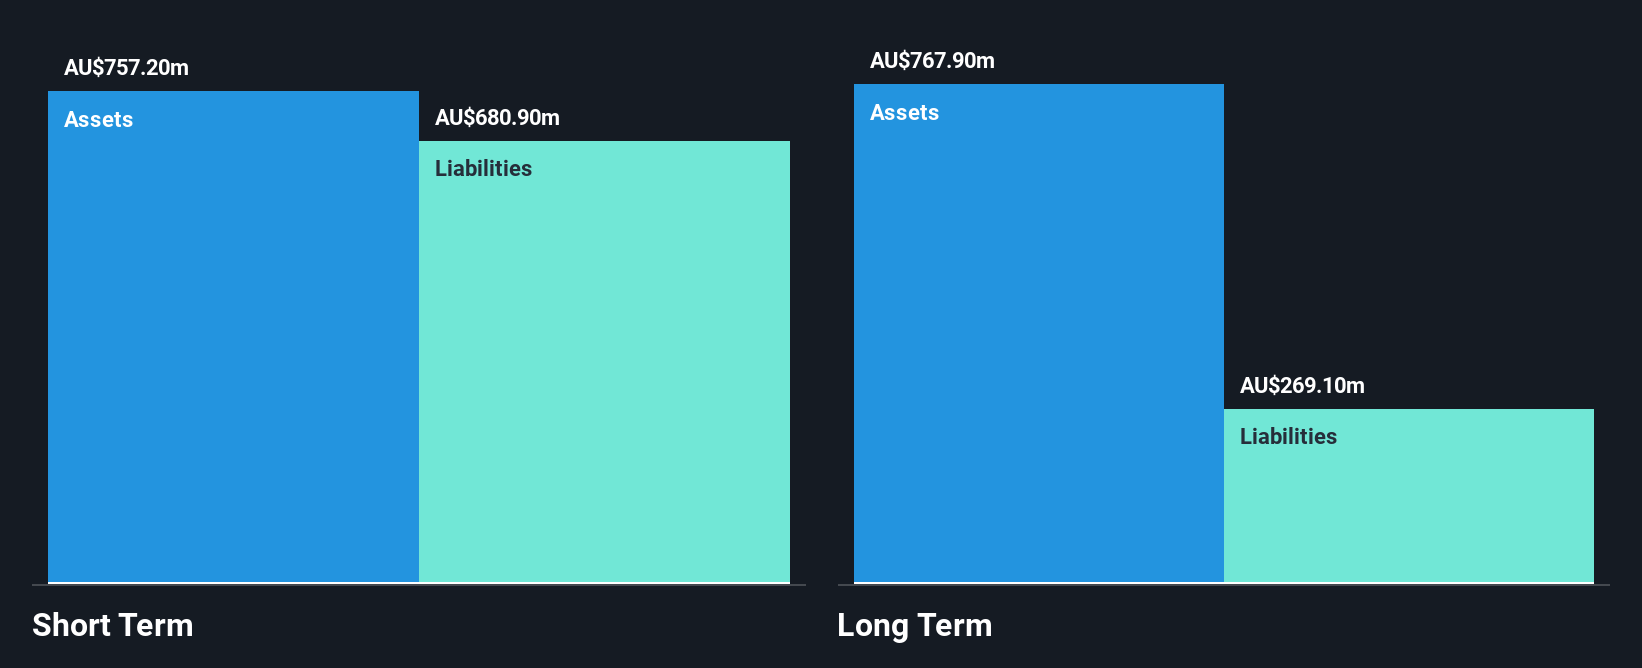
Web Travel Group, with a market cap of A$1.51 billion, demonstrates a complex financial landscape. While its short-term assets of A$757.2 million surpass both short-term and long-term liabilities, the company faces challenges such as declining profit margins (3.4% from 24.6% last year) and negative earnings growth (-85.9%). Despite these hurdles, the company's debt is well-managed with interest payments covered 23.5 times by EBIT and operating cash flow covering 32.9% of debt obligations. Trading at a discount to estimated fair value, Web Travel Group's earnings are projected to grow substantially in the future despite recent volatility in performance metrics.
- Click to explore a detailed breakdown of our findings in Web Travel Group's financial health report.
- Explore Web Travel Group's analyst forecasts in our growth report.
Turning Ideas Into Actions
- Investigate our full lineup of 423 ASX Penny Stocks right here.
- Ready For A Different Approach? We've found 19 US stocks that are forecast to pay a dividend yeild of over 6% next year. See the full list for free.
This article by Simply Wall St is general in nature. We provide commentary based on historical data and analyst forecasts only using an unbiased methodology and our articles are not intended to be financial advice. It does not constitute a recommendation to buy or sell any stock, and does not take account of your objectives, or your financial situation. We aim to bring you long-term focused analysis driven by fundamental data. Note that our analysis may not factor in the latest price-sensitive company announcements or qualitative material. Simply Wall St has no position in any stocks mentioned.
Valuation is complex, but we're here to simplify it.
Discover if Kingsgate Consolidated might be undervalued or overvalued with our detailed analysis, featuring fair value estimates, potential risks, dividends, insider trades, and its financial condition.
Access Free AnalysisHave feedback on this article? Concerned about the content? Get in touch with us directly. Alternatively, email editorial-team@simplywallst.com
About ASX:KCN
Kingsgate Consolidated
Engages in the exploration, development, and mining of mineral properties.
High growth potential with adequate balance sheet.
Similar Companies
Market Insights

Advertisement
Community Narratives
MicroVision will explode future revenue by 380.37% with a vision towards success
Fair Value US$60|98.4% undervalued
TH
Community Contributor
The Indispensable Artery for a New North American Economy
Fair Value CA$132.87|0.6% undervalued
TI
Community Contributor
Recently Updated Narratives
BL


BlackGoat on Alphabet ·
Alphabet: The Under-appreciated Compounder Hiding in Plain Sight
Fair Value:US$324.481.3% undervalued
74 followersusers have followed this narrative
3 commentsusers have commented on this narrative
1 likeusers have liked this narrative
BE


Bejgal on MINISO Group Holding ·
MINISO's fair value is projected at 26.69 with an anticipated PE ratio shift of 20x
Fair Value:US$26.6926.7% undervalued
45 followersusers have followed this narrative
3 commentsusers have commented on this narrative
0 likesusers have liked this narrative
TI


TickerTickle on Oracle ·
The Quiet Giant That Became AI’s Power Grid
Fair Value:US$389.8147.4% undervalued
9 followersusers have followed this narrative
1 commentusers have commented on this narrative
0 likesusers have liked this narrative
Popular Narratives
OS

oscargarcia on Alphabet ·
The company that turned a verb into a global necessity and basically runs the modern internet, digital ads, smartphones, maps, and AI.
Fair Value:US$3405.9% undervalued
136 followersusers have followed this narrative
6 commentsusers have commented on this narrative
18 likesusers have liked this narrative
TH

TheWallstreetKing on MicroVision ·
MicroVision will explode future revenue by 380.37% with a vision towards success
Fair Value:US$6098.4% undervalued
89 followersusers have followed this narrative
10 commentsusers have commented on this narrative
18 likesusers have liked this narrative
AN


AnalystConsensusTarget on NVIDIA ·
NVDA: Expanding AI Demand Will Drive Major Data Center Investments Through 2026
Fair Value:US$232.7922.6% undervalued
927 followersusers have followed this narrative
6 commentsusers have commented on this narrative
22 likesusers have liked this narrative