- Australia
- /
- Metals and Mining
- /
- ASX:IMA
Image Resources (ASX:IMA) Is Experiencing Growth In Returns On Capital

If we want to find a potential multi-bagger, often there are underlying trends that can provide clues. In a perfect world, we'd like to see a company investing more capital into its business and ideally the returns earned from that capital are also increasing. Put simply, these types of businesses are compounding machines, meaning they are continually reinvesting their earnings at ever-higher rates of return. Speaking of which, we noticed some great changes in Image Resources' (ASX:IMA) returns on capital, so let's have a look.
Return On Capital Employed (ROCE): What Is It?
For those who don't know, ROCE is a measure of a company's yearly pre-tax profit (its return), relative to the capital employed in the business. To calculate this metric for Image Resources, this is the formula:
Return on Capital Employed = Earnings Before Interest and Tax (EBIT) ÷ (Total Assets - Current Liabilities)
0.03 = AU$4.4m ÷ (AU$200m - AU$54m) (Based on the trailing twelve months to June 2023).
Thus, Image Resources has an ROCE of 3.0%. Ultimately, that's a low return and it under-performs the Metals and Mining industry average of 11%.
View our latest analysis for Image Resources
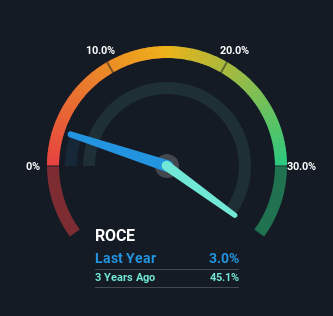
Historical performance is a great place to start when researching a stock so above you can see the gauge for Image Resources' ROCE against it's prior returns. If you'd like to look at how Image Resources has performed in the past in other metrics, you can view this free graph of Image Resources' past earnings, revenue and cash flow.
So How Is Image Resources' ROCE Trending?
The fact that Image Resources is now generating some pre-tax profits from its prior investments is very encouraging. The company was generating losses five years ago, but now it's earning 3.0% which is a sight for sore eyes. In addition to that, Image Resources is employing 42% more capital than previously which is expected of a company that's trying to break into profitability. We like this trend, because it tells us the company has profitable reinvestment opportunities available to it, and if it continues going forward that can lead to a multi-bagger performance.
On a side note, we noticed that the improvement in ROCE appears to be partly fueled by an increase in current liabilities. Effectively this means that suppliers or short-term creditors are now funding 27% of the business, which is more than it was five years ago. Keep an eye out for future increases because when the ratio of current liabilities to total assets gets particularly high, this can introduce some new risks for the business.
The Bottom Line On Image Resources' ROCE
To the delight of most shareholders, Image Resources has now broken into profitability. Astute investors may have an opportunity here because the stock has declined 52% in the last five years. That being the case, research into the company's current valuation metrics and future prospects seems fitting.
One more thing to note, we've identified 3 warning signs with Image Resources and understanding them should be part of your investment process.
While Image Resources isn't earning the highest return, check out this free list of companies that are earning high returns on equity with solid balance sheets.
The New Payments ETF Is Live on NASDAQ:
Money is moving to real-time rails, and a newly listed ETF now gives investors direct exposure. Fast settlement. Institutional custody. Simple access.
Explore how this launch could reshape portfolios
Sponsored ContentNew: AI Stock Screener & Alerts
Our new AI Stock Screener scans the market every day to uncover opportunities.
• Dividend Powerhouses (3%+ Yield)
• Undervalued Small Caps with Insider Buying
• High growth Tech and AI Companies
Or build your own from over 50 metrics.
Have feedback on this article? Concerned about the content? Get in touch with us directly. Alternatively, email editorial-team (at) simplywallst.com.
This article by Simply Wall St is general in nature. We provide commentary based on historical data and analyst forecasts only using an unbiased methodology and our articles are not intended to be financial advice. It does not constitute a recommendation to buy or sell any stock, and does not take account of your objectives, or your financial situation. We aim to bring you long-term focused analysis driven by fundamental data. Note that our analysis may not factor in the latest price-sensitive company announcements or qualitative material. Simply Wall St has no position in any stocks mentioned.
About ASX:IMA
Image Resources
Engages in the production and exploration of mineral sands in Western Australia.
High growth potential and slightly overvalued.
Similar Companies
Market Insights

Weekly Picks

Early mover in a fast growing industry. Likely to experience share price volatility as they scale


A case for CA$31.80 (undiluted), aka 8,616% upside from CA$0.37 (an 86 bagger!).


Moderation and Stabilisation: HOLD: Fair Price based on a 4-year Cycle is $12.08
Recently Updated Narratives


An amazing opportunity to potentially get a 100 bagger

Amazon: Why the World’s Biggest Platform Still Runs on Invisible Economics

Sunrun Stock: When the Energy Transition Collides With the Cost of Capital
Popular Narratives


MicroVision will explode future revenue by 380.37% with a vision towards success


Crazy Undervalued 42 Baggers Silver Play (Active & Running Mine)


NVDA: Expanding AI Demand Will Drive Major Data Center Investments Through 2026
Trending Discussion
