- Australia
- /
- Metals and Mining
- /
- ASX:GOR
Is Gold Road Resources Limited's (ASX:GOR) Recent Price Movement Underpinned By Its Weak Fundamentals?


With its stock down 22% over the past three months, it is easy to disregard Gold Road Resources (ASX:GOR). It seems that the market might have completely ignored the positive aspects of the company's fundamentals and decided to weigh-in more on the negative aspects. Stock prices are usually driven by a company’s financial performance over the long term, and therefore we decided to pay more attention to the company's financial performance. Particularly, we will be paying attention to Gold Road Resources' ROE today.
ROE or return on equity is a useful tool to assess how effectively a company can generate returns on the investment it received from its shareholders. In other words, it is a profitability ratio which measures the rate of return on the capital provided by the company's shareholders.
Check out our latest analysis for Gold Road Resources
How Is ROE Calculated?
ROE can be calculated by using the formula:
Return on Equity = Net Profit (from continuing operations) ÷ Shareholders' Equity
So, based on the above formula, the ROE for Gold Road Resources is:
9.7% = AU$36m ÷ AU$369m (Based on the trailing twelve months to June 2020).
The 'return' is the amount earned after tax over the last twelve months. One way to conceptualize this is that for each A$1 of shareholders' capital it has, the company made A$0.10 in profit.
What Is The Relationship Between ROE And Earnings Growth?
Thus far, we have learned that ROE measures how efficiently a company is generating its profits. Based on how much of its profits the company chooses to reinvest or "retain", we are then able to evaluate a company's future ability to generate profits. Assuming all else is equal, companies that have both a higher return on equity and higher profit retention are usually the ones that have a higher growth rate when compared to companies that don't have the same features.
Gold Road Resources' Earnings Growth And 9.7% ROE
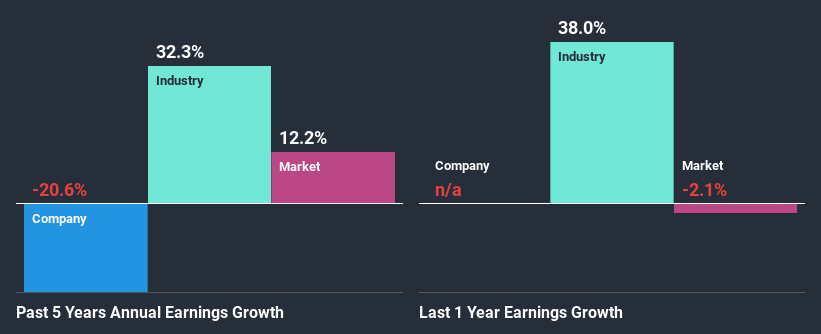
When you first look at it, Gold Road Resources' ROE doesn't look that attractive. A quick further study shows that the company's ROE doesn't compare favorably to the industry average of 13% either. For this reason, Gold Road Resources' five year net income decline of 21% is not surprising given its lower ROE. We believe that there also might be other aspects that are negatively influencing the company's earnings prospects. For instance, the company has a very high payout ratio, or is faced with competitive pressures.
However, when we compared Gold Road Resources' growth with the industry we found that while the company's earnings have been shrinking, the industry has seen an earnings growth of 32% in the same period. This is quite worrisome.
Earnings growth is an important metric to consider when valuing a stock. It’s important for an investor to know whether the market has priced in the company's expected earnings growth (or decline). This then helps them determine if the stock is placed for a bright or bleak future. Has the market priced in the future outlook for GOR? You can find out in our latest intrinsic value infographic research report.
Is Gold Road Resources Efficiently Re-investing Its Profits?
Summary
In total, we're a bit ambivalent about Gold Road Resources' performance. While the company does have a high rate of reinvestment, the low ROE means that all that reinvestment is not reaping any benefit to its investors, and moreover, its having a negative impact on the earnings growth. That being so, the latest industry analyst forecasts show that the analysts are expecting to see a huge improvement in the company's earnings growth rate. Are these analysts expectations based on the broad expectations for the industry, or on the company's fundamentals? Click here to be taken to our analyst's forecasts page for the company.
If you’re looking to trade Gold Road Resources, open an account with the lowest-cost* platform trusted by professionals, Interactive Brokers. Their clients from over 200 countries and territories trade stocks, options, futures, forex, bonds and funds worldwide from a single integrated account. Promoted
New: Manage All Your Stock Portfolios in One Place
We've created the ultimate portfolio companion for stock investors, and it's free.
• Connect an unlimited number of Portfolios and see your total in one currency
• Be alerted to new Warning Signs or Risks via email or mobile
• Track the Fair Value of your stocks
This article by Simply Wall St is general in nature. It does not constitute a recommendation to buy or sell any stock, and does not take account of your objectives, or your financial situation. We aim to bring you long-term focused analysis driven by fundamental data. Note that our analysis may not factor in the latest price-sensitive company announcements or qualitative material. Simply Wall St has no position in any stocks mentioned.
*Interactive Brokers Rated Lowest Cost Broker by StockBrokers.com Annual Online Review 2020
Have feedback on this article? Concerned about the content? Get in touch with us directly. Alternatively, email editorial-team@simplywallst.com.
About ASX:GOR
Gold Road Resources
Engages in the exploration of gold properties in Western Australia.
Excellent balance sheet with reasonable growth potential.
Similar Companies
Market Insights

Community Narratives


