- Australia
- /
- Metals and Mining
- /
- ASX:BCI
Even though BCI Minerals (ASX:BCI) has lost AU$36m market cap in last 7 days, shareholders are still up 80% over 5 years


BCI Minerals Limited (ASX:BCI) shareholders have seen the share price descend 22% over the month. On the bright side the returns have been quite good over the last half decade. It has returned a market beating 69% in that time.
While this past week has detracted from the company's five-year return, let's look at the recent trends of the underlying business and see if the gains have been in alignment.
View our latest analysis for BCI Minerals
While the efficient markets hypothesis continues to be taught by some, it has been proven that markets are over-reactive dynamic systems, and investors are not always rational. One flawed but reasonable way to assess how sentiment around a company has changed is to compare the earnings per share (EPS) with the share price.
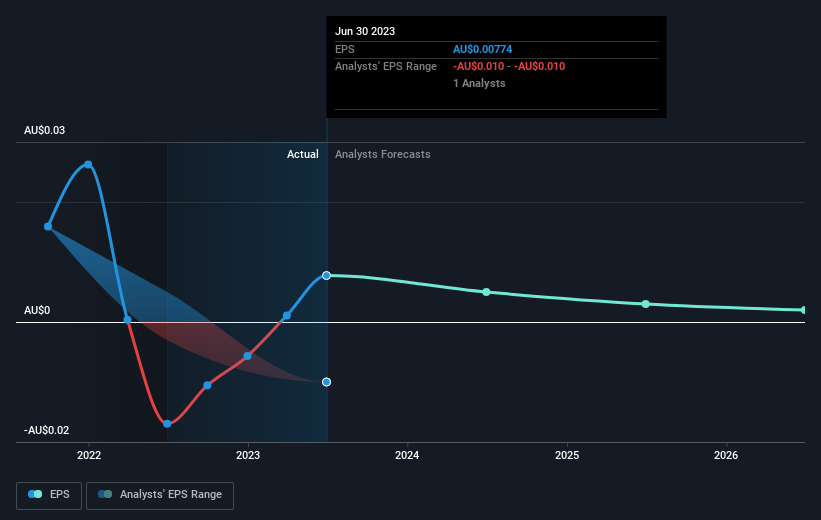
During the last half decade, BCI Minerals became profitable. That would generally be considered a positive, so we'd expect the share price to be up. Since the company was unprofitable five years ago, but not three years ago, it's worth taking a look at the returns in the last three years, too. We can see that the BCI Minerals share price is down 23% in the last three years. During the same period, EPS grew by 101% each year. So there seems to be a mismatch between the positive EPS growth and the change in the share price, which is down -9% per year.
The company's earnings per share (over time) is depicted in the image below (click to see the exact numbers).
It is of course excellent to see how BCI Minerals has grown profits over the years, but the future is more important for shareholders. Take a more thorough look at BCI Minerals' financial health with this free report on its balance sheet.
What About The Total Shareholder Return (TSR)?
We'd be remiss not to mention the difference between BCI Minerals' total shareholder return (TSR) and its share price return. Arguably the TSR is a more complete return calculation because it accounts for the value of dividends (as if they were reinvested), along with the hypothetical value of any discounted capital that have been offered to shareholders. Its history of dividend payouts mean that BCI Minerals' TSR of 80% over the last 5 years is better than the share price return.
A Different Perspective
BCI Minerals shareholders are down 8.7% for the year, but the market itself is up 5.3%. However, keep in mind that even the best stocks will sometimes underperform the market over a twelve month period. Longer term investors wouldn't be so upset, since they would have made 12%, each year, over five years. If the fundamental data continues to indicate long term sustainable growth, the current sell-off could be an opportunity worth considering. I find it very interesting to look at share price over the long term as a proxy for business performance. But to truly gain insight, we need to consider other information, too. Consider for instance, the ever-present spectre of investment risk. We've identified 2 warning signs with BCI Minerals , and understanding them should be part of your investment process.
We will like BCI Minerals better if we see some big insider buys. While we wait, check out this free list of growing companies with considerable, recent, insider buying.
Please note, the market returns quoted in this article reflect the market weighted average returns of stocks that currently trade on Australian exchanges.
Valuation is complex, but we're here to simplify it.
Discover if BCI Minerals might be undervalued or overvalued with our detailed analysis, featuring fair value estimates, potential risks, dividends, insider trades, and its financial condition.
Access Free AnalysisHave feedback on this article? Concerned about the content? Get in touch with us directly. Alternatively, email editorial-team (at) simplywallst.com.
This article by Simply Wall St is general in nature. We provide commentary based on historical data and analyst forecasts only using an unbiased methodology and our articles are not intended to be financial advice. It does not constitute a recommendation to buy or sell any stock, and does not take account of your objectives, or your financial situation. We aim to bring you long-term focused analysis driven by fundamental data. Note that our analysis may not factor in the latest price-sensitive company announcements or qualitative material. Simply Wall St has no position in any stocks mentioned.
About ASX:BCI
BCI Minerals
A mineral resources company, engages in the development of mineral assets in Australia.
Excellent balance sheet low.
