
Advertisement
- Australia
- /
- Personal Products
- /
- ASX:S66
Star Combo Pharma's (ASX:S66) Robust Earnings Might Be Weaker Than You Think

Shareholders didn't seem to be thrilled with Star Combo Pharma Limited's (ASX:S66) recent earnings report, despite healthy profit numbers. Our analysis suggests they may be concerned about some underlying details.
View our latest analysis for Star Combo Pharma
Examining Cashflow Against Star Combo Pharma's Earnings
One key financial ratio used to measure how well a company converts its profit to free cash flow (FCF) is the accrual ratio. The accrual ratio subtracts the FCF from the profit for a given period, and divides the result by the average operating assets of the company over that time. This ratio tells us how much of a company's profit is not backed by free cashflow.
That means a negative accrual ratio is a good thing, because it shows that the company is bringing in more free cash flow than its profit would suggest. That is not intended to imply we should worry about a positive accrual ratio, but it's worth noting where the accrual ratio is rather high. That's because some academic studies have suggested that high accruals ratios tend to lead to lower profit or less profit growth.
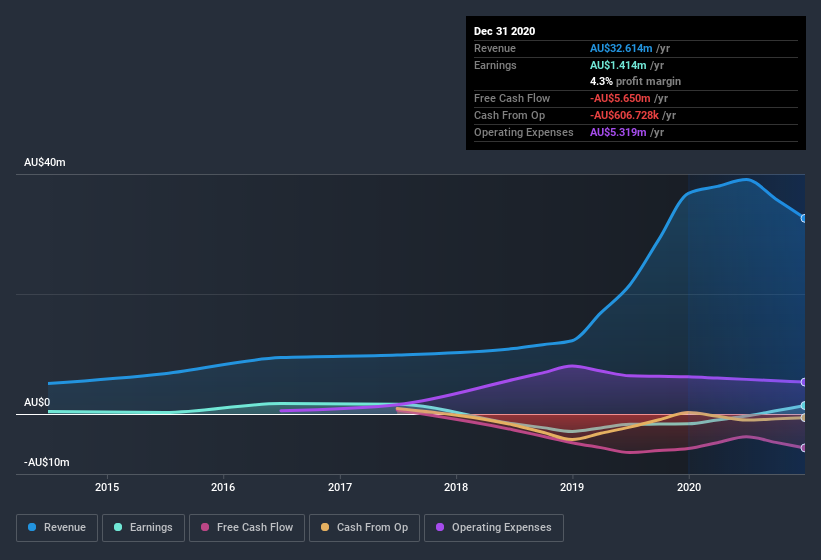
Over the twelve months to December 2020, Star Combo Pharma recorded an accrual ratio of 0.34. Unfortunately, that means its free cash flow was a lot less than its statutory profit, which makes us doubt the utility of profit as a guide. Even though it reported a profit of AU$1.41m, a look at free cash flow indicates it actually burnt through AU$5.7m in the last year. We also note that Star Combo Pharma's free cash flow was actually negative last year as well, so we could understand if shareholders were bothered by its outflow of AU$5.7m. Having said that, there is more to consider. We can look at how unusual items in the profit and loss statement impacted its accrual ratio, as well as explore how dilution is impacting shareholders negatively.
Note: we always recommend investors check balance sheet strength. Click here to be taken to our balance sheet analysis of Star Combo Pharma.
In order to understand the potential for per share returns, it is essential to consider how much a company is diluting shareholders. As it happens, Star Combo Pharma issued 56% more new shares over the last year. That means its earnings are split among a greater number of shares. To talk about net income, without noticing earnings per share, is to be distracted by the big numbers while ignoring the smaller numbers that talk to per share value. You can see a chart of Star Combo Pharma's EPS by clicking here.
A Look At The Impact Of Star Combo Pharma's Dilution on Its Earnings Per Share (EPS).
Star Combo Pharma was losing money three years ago. And even focusing only on the last twelve months, we don't have a meaningful growth rate because it made a loss a year ago, too. What we do know is that while it's great to see a profit over the last twelve months, that profit would have been better, on a per share basis, if the company hadn't needed to issue shares. And so, you can see quite clearly that dilution is having a rather significant impact on shareholders.
In the long term, if Star Combo Pharma's earnings per share can increase, then the share price should too. But on the other hand, we'd be far less excited to learn profit (but not EPS) was improving. For the ordinary retail shareholder, EPS is a great measure to check your hypothetical "share" of the company's profit.
How Do Unusual Items Influence Profit?
Given the accrual ratio, it's not overly surprising that Star Combo Pharma's profit was boosted by unusual items worth AU$838k in the last twelve months. While we like to see profit increases, we tend to be a little more cautious when unusual items have made a big contribution. When we crunched the numbers on thousands of publicly listed companies, we found that a boost from unusual items in a given year is often not repeated the next year. And, after all, that's exactly what the accounting terminology implies. Star Combo Pharma had a rather significant contribution from unusual items relative to its profit to December 2020. All else being equal, this would likely have the effect of making the statutory profit a poor guide to underlying earnings power.
Our Take On Star Combo Pharma's Profit Performance
In conclusion, Star Combo Pharma's weak accrual ratio suggested its statutory earnings have been inflated by the unusual items. Meanwhile, the new shares issued mean that shareholders now own less of the company, unless they tipped in more cash themselves. On reflection, the above-mentioned factors give us the strong impression that Star Combo Pharma'sunderlying earnings power is not as good as it might seem, based on the statutory profit numbers. With this in mind, we wouldn't consider investing in a stock unless we had a thorough understanding of the risks. Be aware that Star Combo Pharma is showing 3 warning signs in our investment analysis and 2 of those are concerning...
Our examination of Star Combo Pharma has focussed on certain factors that can make its earnings look better than they are. And, on that basis, we are somewhat skeptical. But there is always more to discover if you are capable of focussing your mind on minutiae. Some people consider a high return on equity to be a good sign of a quality business. While it might take a little research on your behalf, you may find this free collection of companies boasting high return on equity, or this list of stocks that insiders are buying to be useful.
When trading Star Combo Pharma or any other investment, use the platform considered by many to be the Professional's Gateway to the Worlds Market, Interactive Brokers. You get the lowest-cost* trading on stocks, options, futures, forex, bonds and funds worldwide from a single integrated account. Promoted
New: Manage All Your Stock Portfolios in One Place
We've created the ultimate portfolio companion for stock investors, and it's free.
• Connect an unlimited number of Portfolios and see your total in one currency
• Be alerted to new Warning Signs or Risks via email or mobile
• Track the Fair Value of your stocks
This article by Simply Wall St is general in nature. It does not constitute a recommendation to buy or sell any stock, and does not take account of your objectives, or your financial situation. We aim to bring you long-term focused analysis driven by fundamental data. Note that our analysis may not factor in the latest price-sensitive company announcements or qualitative material. Simply Wall St has no position in any stocks mentioned.
*Interactive Brokers Rated Lowest Cost Broker by StockBrokers.com Annual Online Review 2020
Have feedback on this article? Concerned about the content? Get in touch with us directly. Alternatively, email editorial-team (at) simplywallst.com.
About ASX:S66
Star Combo Pharma
Engages in the manufacturing and distribution of health food products and nutritional supplements in Australia and China.
Flawless balance sheet with solid track record.
Market Insights

Advertisement
Community Narratives
Pinterest will surge as advertising innovations ignite revenue growth
Fair Value US$42.63|27.0% undervalued
BR
Community Contributor
Brambles' Revenue Set to Climb 14% with Profit Margins Following
Fair Value AU$21.90|5.9% overvalued
RO
Community Contributor
Challenging Future for STG as Organic Sales Decline by 8.8%
Fair Value DKK 116.13|26.8% undervalued
KA
Community Contributor