- Australia
- /
- Personal Products
- /
- ASX:S66
Star Combo Pharma Limited's (ASX:S66) 27% Dip Still Leaving Some Shareholders Feeling Restless Over Its P/SRatio


Star Combo Pharma Limited (ASX:S66) shareholders that were waiting for something to happen have been dealt a blow with a 27% share price drop in the last month. Longer-term shareholders will rue the drop in the share price, since it's now virtually flat for the year after a promising few quarters.
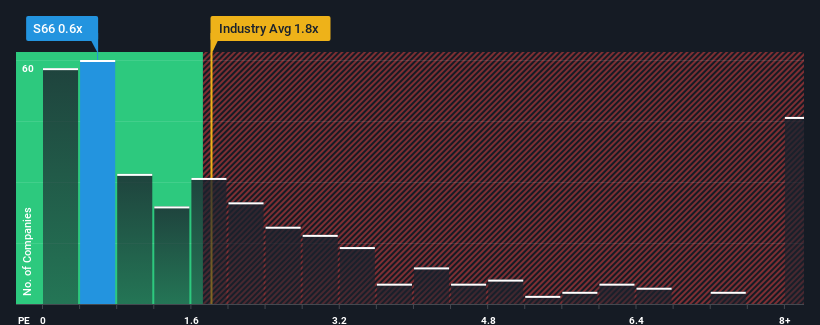
In spite of the heavy fall in price, there still wouldn't be many who think Star Combo Pharma's price-to-sales (or "P/S") ratio of 0.6x is worth a mention when the median P/S in Australia's Personal Products industry is similar at about 0.7x. Although, it's not wise to simply ignore the P/S without explanation as investors may be disregarding a distinct opportunity or a costly mistake.
See our latest analysis for Star Combo Pharma
How Has Star Combo Pharma Performed Recently?
Revenue has risen firmly for Star Combo Pharma recently, which is pleasing to see. It might be that many expect the respectable revenue performance to wane, which has kept the P/S from rising. If you like the company, you'd be hoping this isn't the case so that you could potentially pick up some stock while it's not quite in favour.
Want the full picture on earnings, revenue and cash flow for the company? Then our free report on Star Combo Pharma will help you shine a light on its historical performance.How Is Star Combo Pharma's Revenue Growth Trending?
In order to justify its P/S ratio, Star Combo Pharma would need to produce growth that's similar to the industry.
Retrospectively, the last year delivered a decent 12% gain to the company's revenues. Ultimately though, it couldn't turn around the poor performance of the prior period, with revenue shrinking 22% in total over the last three years. Accordingly, shareholders would have felt downbeat about the medium-term rates of revenue growth.
Weighing that medium-term revenue trajectory against the broader industry's one-year forecast for expansion of 7.4% shows it's an unpleasant look.
With this in mind, we find it worrying that Star Combo Pharma's P/S exceeds that of its industry peers. Apparently many investors in the company are way less bearish than recent times would indicate and aren't willing to let go of their stock right now. Only the boldest would assume these prices are sustainable as a continuation of recent revenue trends is likely to weigh on the share price eventually.
What We Can Learn From Star Combo Pharma's P/S?
With its share price dropping off a cliff, the P/S for Star Combo Pharma looks to be in line with the rest of the Personal Products industry. Generally, our preference is to limit the use of the price-to-sales ratio to establishing what the market thinks about the overall health of a company.
The fact that Star Combo Pharma currently trades at a P/S on par with the rest of the industry is surprising to us since its recent revenues have been in decline over the medium-term, all while the industry is set to grow. Even though it matches the industry, we're uncomfortable with the current P/S ratio, as this dismal revenue performance is unlikely to support a more positive sentiment for long. If recent medium-term revenue trends continue, it will place shareholders' investments at risk and potential investors in danger of paying an unnecessary premium.
There are also other vital risk factors to consider and we've discovered 2 warning signs for Star Combo Pharma (1 is significant!) that you should be aware of before investing here.
It's important to make sure you look for a great company, not just the first idea you come across. So if growing profitability aligns with your idea of a great company, take a peek at this free list of interesting companies with strong recent earnings growth (and a low P/E).
New: Manage All Your Stock Portfolios in One Place
We've created the ultimate portfolio companion for stock investors, and it's free.
• Connect an unlimited number of Portfolios and see your total in one currency
• Be alerted to new Warning Signs or Risks via email or mobile
• Track the Fair Value of your stocks
Have feedback on this article? Concerned about the content? Get in touch with us directly. Alternatively, email editorial-team (at) simplywallst.com.
This article by Simply Wall St is general in nature. We provide commentary based on historical data and analyst forecasts only using an unbiased methodology and our articles are not intended to be financial advice. It does not constitute a recommendation to buy or sell any stock, and does not take account of your objectives, or your financial situation. We aim to bring you long-term focused analysis driven by fundamental data. Note that our analysis may not factor in the latest price-sensitive company announcements or qualitative material. Simply Wall St has no position in any stocks mentioned.
About ASX:S66
Star Combo Pharma
Engages in the manufacturing and distribution of health food products and nutritional supplements in Australia and China.
Excellent balance sheet with acceptable track record.

