- Australia
- /
- Healthcare Services
- /
- ASX:SHL
Sonic Healthcare Limited's (ASX:SHL) Intrinsic Value Is Potentially 90% Above Its Share Price


Key Insights
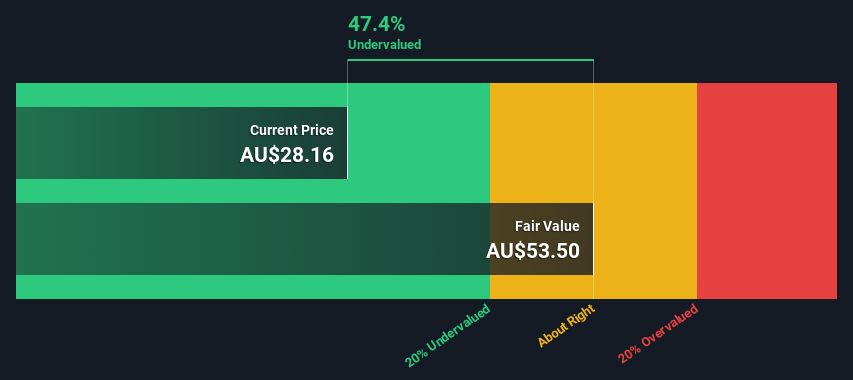
- Using the 2 Stage Free Cash Flow to Equity, Sonic Healthcare fair value estimate is AU$53.50
- Current share price of AU$28.16 suggests Sonic Healthcare is potentially 47% undervalued
- Analyst price target for SHL is AU$30.61 which is 43% below our fair value estimate
How far off is Sonic Healthcare Limited (ASX:SHL) from its intrinsic value? Using the most recent financial data, we'll take a look at whether the stock is fairly priced by projecting its future cash flows and then discounting them to today's value. We will use the Discounted Cash Flow (DCF) model on this occasion. It may sound complicated, but actually it is quite simple!
We generally believe that a company's value is the present value of all of the cash it will generate in the future. However, a DCF is just one valuation metric among many, and it is not without flaws. For those who are keen learners of equity analysis, the Simply Wall St analysis model here may be something of interest to you.
Check out our latest analysis for Sonic Healthcare
Is Sonic Healthcare Fairly Valued?
We're using the 2-stage growth model, which simply means we take in account two stages of company's growth. In the initial period the company may have a higher growth rate and the second stage is usually assumed to have a stable growth rate. To begin with, we have to get estimates of the next ten years of cash flows. Where possible we use analyst estimates, but when these aren't available we extrapolate the previous free cash flow (FCF) from the last estimate or reported value. We assume companies with shrinking free cash flow will slow their rate of shrinkage, and that companies with growing free cash flow will see their growth rate slow, over this period. We do this to reflect that growth tends to slow more in the early years than it does in later years.
Generally we assume that a dollar today is more valuable than a dollar in the future, so we need to discount the sum of these future cash flows to arrive at a present value estimate:
10-year free cash flow (FCF) estimate
| 2024 | 2025 | 2026 | 2027 | 2028 | 2029 | 2030 | 2031 | 2032 | 2033 | |
| Levered FCF (A$, Millions) | AU$760.9m | AU$985.1m | AU$1.06b | AU$991.5m | AU$1.05b | AU$1.06b | AU$1.08b | AU$1.10b | AU$1.12b | AU$1.14b |
| Growth Rate Estimate Source | Analyst x7 | Analyst x7 | Analyst x7 | Analyst x2 | Analyst x2 | Est @ 1.45% | Est @ 1.66% | Est @ 1.81% | Est @ 1.92% | Est @ 1.99% |
| Present Value (A$, Millions) Discounted @ 5.8% | AU$719 | AU$879 | AU$895 | AU$790 | AU$789 | AU$756 | AU$726 | AU$699 | AU$673 | AU$648 |
("Est" = FCF growth rate estimated by Simply Wall St)
Present Value of 10-year Cash Flow (PVCF) = AU$7.6b
We now need to calculate the Terminal Value, which accounts for all the future cash flows after this ten year period. For a number of reasons a very conservative growth rate is used that cannot exceed that of a country's GDP growth. In this case we have used the 5-year average of the 10-year government bond yield (2.2%) to estimate future growth. In the same way as with the 10-year 'growth' period, we discount future cash flows to today's value, using a cost of equity of 5.8%.
Terminal Value (TV)= FCF2033 × (1 + g) ÷ (r – g) = AU$1.1b× (1 + 2.2%) ÷ (5.8%– 2.2%) = AU$32b
Present Value of Terminal Value (PVTV)= TV / (1 + r)10= AU$32b÷ ( 1 + 5.8%)10= AU$18b
The total value is the sum of cash flows for the next ten years plus the discounted terminal value, which results in the Total Equity Value, which in this case is AU$26b. In the final step we divide the equity value by the number of shares outstanding. Relative to the current share price of AU$28.2, the company appears quite undervalued at a 47% discount to where the stock price trades currently. Remember though, that this is just an approximate valuation, and like any complex formula - garbage in, garbage out.
Important Assumptions
The calculation above is very dependent on two assumptions. The first is the discount rate and the other is the cash flows. You don't have to agree with these inputs, I recommend redoing the calculations yourself and playing with them. The DCF also does not consider the possible cyclicality of an industry, or a company's future capital requirements, so it does not give a full picture of a company's potential performance. Given that we are looking at Sonic Healthcare as potential shareholders, the cost of equity is used as the discount rate, rather than the cost of capital (or weighted average cost of capital, WACC) which accounts for debt. In this calculation we've used 5.8%, which is based on a levered beta of 0.800. Beta is a measure of a stock's volatility, compared to the market as a whole. We get our beta from the industry average beta of globally comparable companies, with an imposed limit between 0.8 and 2.0, which is a reasonable range for a stable business.
SWOT Analysis for Sonic Healthcare
- Debt is not viewed as a risk.
- Earnings declined over the past year.
- Dividend is low compared to the top 25% of dividend payers in the Healthcare market.
- Annual earnings are forecast to grow faster than the Australian market.
- Good value based on P/E ratio and estimated fair value.
- Dividends are not covered by earnings.
- Revenue is forecast to grow slower than 20% per year.
Next Steps:
Whilst important, the DCF calculation shouldn't be the only metric you look at when researching a company. DCF models are not the be-all and end-all of investment valuation. Rather it should be seen as a guide to "what assumptions need to be true for this stock to be under/overvalued?" If a company grows at a different rate, or if its cost of equity or risk free rate changes sharply, the output can look very different. Can we work out why the company is trading at a discount to intrinsic value? For Sonic Healthcare, we've put together three further aspects you should explore:
- Risks: You should be aware of the 2 warning signs for Sonic Healthcare we've uncovered before considering an investment in the company.
- Future Earnings: How does SHL's growth rate compare to its peers and the wider market? Dig deeper into the analyst consensus number for the upcoming years by interacting with our free analyst growth expectation chart.
- Other High Quality Alternatives: Do you like a good all-rounder? Explore our interactive list of high quality stocks to get an idea of what else is out there you may be missing!
PS. Simply Wall St updates its DCF calculation for every Australian stock every day, so if you want to find the intrinsic value of any other stock just search here.
New: Manage All Your Stock Portfolios in One Place
We've created the ultimate portfolio companion for stock investors, and it's free.
• Connect an unlimited number of Portfolios and see your total in one currency
• Be alerted to new Warning Signs or Risks via email or mobile
• Track the Fair Value of your stocks
Have feedback on this article? Concerned about the content? Get in touch with us directly. Alternatively, email editorial-team (at) simplywallst.com.
This article by Simply Wall St is general in nature. We provide commentary based on historical data and analyst forecasts only using an unbiased methodology and our articles are not intended to be financial advice. It does not constitute a recommendation to buy or sell any stock, and does not take account of your objectives, or your financial situation. We aim to bring you long-term focused analysis driven by fundamental data. Note that our analysis may not factor in the latest price-sensitive company announcements or qualitative material. Simply Wall St has no position in any stocks mentioned.
About ASX:SHL
Sonic Healthcare
Offers medical diagnostic and administrative services to medical practitioners, hospitals, community health services, and patients in Australia, the United States, Germany, and internationally.
Excellent balance sheet average dividend payer.
Similar Companies
Market Insights

Community Narratives

