Lynch Group Holdings Limited (ASX:LGL) Stock Rockets 48% But Many Are Still Ignoring The Company


Lynch Group Holdings Limited (ASX:LGL) shareholders have had their patience rewarded with a 48% share price jump in the last month. Looking further back, the 20% rise over the last twelve months isn't too bad notwithstanding the strength over the last 30 days.
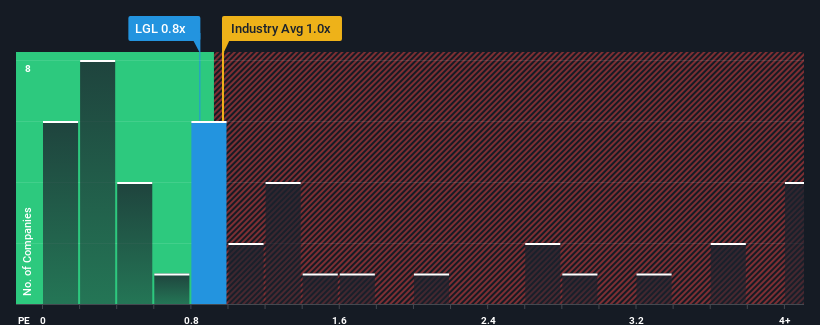
Even after such a large jump in price, there still wouldn't be many who think Lynch Group Holdings' price-to-sales (or "P/S") ratio of 0.8x is worth a mention when the median P/S in Australia's Food industry is similar at about 1x. While this might not raise any eyebrows, if the P/S ratio is not justified investors could be missing out on a potential opportunity or ignoring looming disappointment.
See our latest analysis for Lynch Group Holdings
What Does Lynch Group Holdings' P/S Mean For Shareholders?
Recent times haven't been great for Lynch Group Holdings as its revenue has been rising slower than most other companies. One possibility is that the P/S ratio is moderate because investors think this lacklustre revenue performance will turn around. If not, then existing shareholders may be a little nervous about the viability of the share price.
Keen to find out how analysts think Lynch Group Holdings' future stacks up against the industry? In that case, our free report is a great place to start.How Is Lynch Group Holdings' Revenue Growth Trending?
There's an inherent assumption that a company should be matching the industry for P/S ratios like Lynch Group Holdings' to be considered reasonable.
If we review the last year of revenue growth, the company posted a worthy increase of 12%. This was backed up an excellent period prior to see revenue up by 63% in total over the last three years. Therefore, it's fair to say the revenue growth recently has been superb for the company.
Turning to the outlook, the next three years should generate growth of 8.4% each year as estimated by the dual analysts watching the company. That's shaping up to be materially higher than the 6.2% each year growth forecast for the broader industry.
With this information, we find it interesting that Lynch Group Holdings is trading at a fairly similar P/S compared to the industry. It may be that most investors aren't convinced the company can achieve future growth expectations.
What We Can Learn From Lynch Group Holdings' P/S?
Lynch Group Holdings appears to be back in favour with a solid price jump bringing its P/S back in line with other companies in the industry It's argued the price-to-sales ratio is an inferior measure of value within certain industries, but it can be a powerful business sentiment indicator.
Looking at Lynch Group Holdings' analyst forecasts revealed that its superior revenue outlook isn't giving the boost to its P/S that we would've expected. When we see a strong revenue outlook, with growth outpacing the industry, we can only assume potential uncertainty around these figures are what might be placing slight pressure on the P/S ratio. It appears some are indeed anticipating revenue instability, because these conditions should normally provide a boost to the share price.
It's always necessary to consider the ever-present spectre of investment risk. We've identified 1 warning sign with Lynch Group Holdings, and understanding should be part of your investment process.
It's important to make sure you look for a great company, not just the first idea you come across. So if growing profitability aligns with your idea of a great company, take a peek at this free list of interesting companies with strong recent earnings growth (and a low P/E).
If you're looking to trade Lynch Group Holdings, open an account with the lowest-cost platform trusted by professionals, Interactive Brokers.
With clients in over 200 countries and territories, and access to 160 markets, IBKR lets you trade stocks, options, futures, forex, bonds and funds from a single integrated account.
Enjoy no hidden fees, no account minimums, and FX conversion rates as low as 0.03%, far better than what most brokers offer.
Sponsored ContentNew: AI Stock Screener & Alerts
Our new AI Stock Screener scans the market every day to uncover opportunities.
• Dividend Powerhouses (3%+ Yield)
• Undervalued Small Caps with Insider Buying
• High growth Tech and AI Companies
Or build your own from over 50 metrics.
Have feedback on this article? Concerned about the content? Get in touch with us directly. Alternatively, email editorial-team (at) simplywallst.com.
This article by Simply Wall St is general in nature. We provide commentary based on historical data and analyst forecasts only using an unbiased methodology and our articles are not intended to be financial advice. It does not constitute a recommendation to buy or sell any stock, and does not take account of your objectives, or your financial situation. We aim to bring you long-term focused analysis driven by fundamental data. Note that our analysis may not factor in the latest price-sensitive company announcements or qualitative material. Simply Wall St has no position in any stocks mentioned.
About ASX:LGL
Lynch Group Holdings
Operates as a grower, wholesaler, retailer, and importer of flowers and potted plants in Australia and China.
Moderate growth potential with mediocre balance sheet.
Market Insights

Community Narratives

