
Advertisement
- Australia
- /
- Oil and Gas
- /
- ASX:BTL
Further weakness as Empire Energy Group (ASX:EEG) drops 12% this week, taking three-year losses to 71%
Every investor on earth makes bad calls sometimes. But you want to avoid the really big losses like the plague. So consider, for a moment, the misfortune of Empire Energy Group Limited (ASX:EEG) investors who have held the stock for three years as it declined a whopping 71%. That'd be enough to cause even the strongest minds some disquiet. And more recent buyers are having a tough time too, with a drop of 41% in the last year. Shareholders have had an even rougher run lately, with the share price down 23% in the last 90 days.
With the stock having lost 12% in the past week, it's worth taking a look at business performance and seeing if there's any red flags.
See our latest analysis for Empire Energy Group
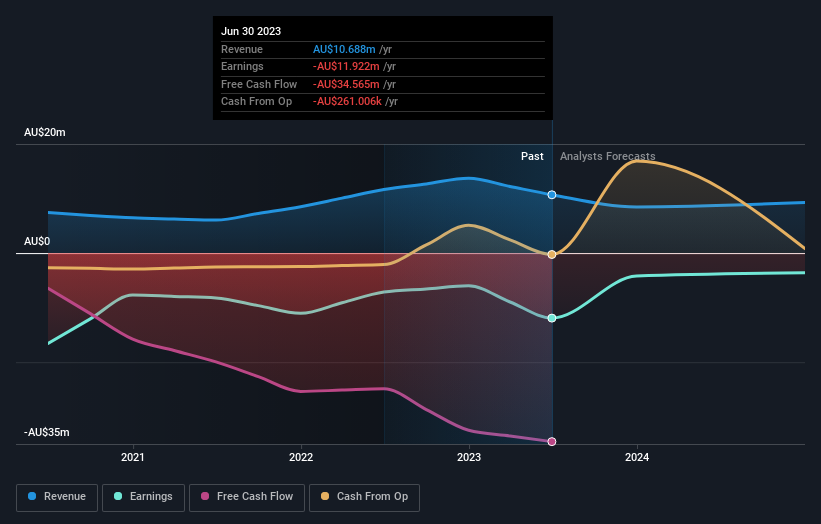
Given that Empire Energy Group didn't make a profit in the last twelve months, we'll focus on revenue growth to form a quick view of its business development. Generally speaking, companies without profits are expected to grow revenue every year, and at a good clip. That's because it's hard to be confident a company will be sustainable if revenue growth is negligible, and it never makes a profit.
In the last three years, Empire Energy Group saw its revenue grow by 26% per year, compound. That's well above most other pre-profit companies. So why has the share priced crashed 19% per year, in the same time? You'd want to take a close look at the balance sheet, as well as the losses. Sometimes fast revenue growth doesn't lead to profits. Unless the balance sheet is strong, the company might have to raise capital.
The graphic below depicts how earnings and revenue have changed over time (unveil the exact values by clicking on the image).
Take a more thorough look at Empire Energy Group's financial health with this free report on its balance sheet.
A Different Perspective
Investors in Empire Energy Group had a tough year, with a total loss of 41%, against a market gain of about 7.0%. Even the share prices of good stocks drop sometimes, but we want to see improvements in the fundamental metrics of a business, before getting too interested. Unfortunately, last year's performance may indicate unresolved challenges, given that it was worse than the annualised loss of 6% over the last half decade. Generally speaking long term share price weakness can be a bad sign, though contrarian investors might want to research the stock in hope of a turnaround. I find it very interesting to look at share price over the long term as a proxy for business performance. But to truly gain insight, we need to consider other information, too. Case in point: We've spotted 3 warning signs for Empire Energy Group you should be aware of, and 1 of them is potentially serious.
We will like Empire Energy Group better if we see some big insider buys. While we wait, check out this free list of growing companies with considerable, recent, insider buying.
Please note, the market returns quoted in this article reflect the market weighted average returns of stocks that currently trade on Australian exchanges.
Valuation is complex, but we're here to simplify it.
Discover if Beetaloo Energy Australia might be undervalued or overvalued with our detailed analysis, featuring fair value estimates, potential risks, dividends, insider trades, and its financial condition.
Access Free AnalysisHave feedback on this article? Concerned about the content? Get in touch with us directly. Alternatively, email editorial-team (at) simplywallst.com.
This article by Simply Wall St is general in nature. We provide commentary based on historical data and analyst forecasts only using an unbiased methodology and our articles are not intended to be financial advice. It does not constitute a recommendation to buy or sell any stock, and does not take account of your objectives, or your financial situation. We aim to bring you long-term focused analysis driven by fundamental data. Note that our analysis may not factor in the latest price-sensitive company announcements or qualitative material. Simply Wall St has no position in any stocks mentioned.
About ASX:BTL
Beetaloo Energy Australia
Together its subsidiaries, engages in the production and sale of oil and natural gas in Australia.
High growth potential with excellent balance sheet.
Similar Companies
Market Insights

Advertisement
Community Narratives
The "Molecular Pencil": Why Beam's Technology is Built to Win
Fair Value US$65.01|65.4% undervalued
DA
Community Contributor
The silent giant behind virtually every advanced chip powering AI, smartphones, and modern infrastructure.
Fair Value US$310.00|6.1% undervalued
OS
Community Contributor
ADP Stock: Solid Fundamentals, But AI Investments Test Its Margin Resilience
Fair Value US$387.77|34.2% undervalued
YI
Community Contributor
MINISO's fair value is projected at 26.69 with an anticipated PE ratio shift of 20x
Fair Value US$24.03|9.6% undervalued
BE
Community Contributor