- Australia
- /
- Capital Markets
- /
- ASX:TGP
Further weakness as 360 Capital Group (ASX:TGP) drops 11% this week, taking five-year losses to 29%


In order to justify the effort of selecting individual stocks, it's worth striving to beat the returns from a market index fund. But every investor is virtually certain to have both over-performing and under-performing stocks. So we wouldn't blame long term 360 Capital Group Limited (ASX:TGP) shareholders for doubting their decision to hold, with the stock down 51% over a half decade. And it's not just long term holders hurting, because the stock is down 39% in the last year. On top of that, the share price is down 11% in the last week.
If the past week is anything to go by, investor sentiment for 360 Capital Group isn't positive, so let's see if there's a mismatch between fundamentals and the share price.
View our latest analysis for 360 Capital Group
To paraphrase Benjamin Graham: Over the short term the market is a voting machine, but over the long term it's a weighing machine. One imperfect but simple way to consider how the market perception of a company has shifted is to compare the change in the earnings per share (EPS) with the share price movement.
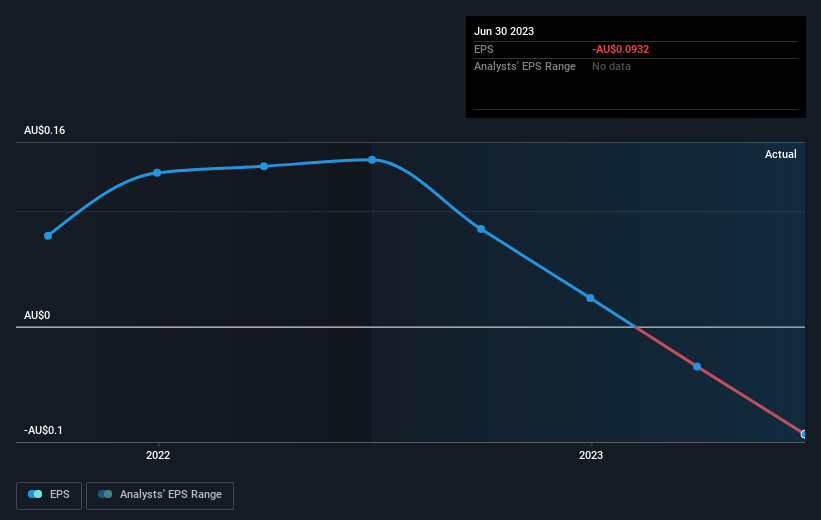
In the last half decade 360 Capital Group saw its share price fall as its EPS declined below zero. Since the company has fallen to a loss making position, it's hard to compare the change in EPS with the share price change. However, we can say we'd expect to see a falling share price in this scenario.
You can see below how EPS has changed over time (discover the exact values by clicking on the image).
We like that insiders have been buying shares in the last twelve months. Having said that, most people consider earnings and revenue growth trends to be a more meaningful guide to the business. This free interactive report on 360 Capital Group's earnings, revenue and cash flow is a great place to start, if you want to investigate the stock further.
What About Dividends?
As well as measuring the share price return, investors should also consider the total shareholder return (TSR). The TSR is a return calculation that accounts for the value of cash dividends (assuming that any dividend received was reinvested) and the calculated value of any discounted capital raisings and spin-offs. Arguably, the TSR gives a more comprehensive picture of the return generated by a stock. We note that for 360 Capital Group the TSR over the last 5 years was -29%, which is better than the share price return mentioned above. And there's no prize for guessing that the dividend payments largely explain the divergence!
A Different Perspective
360 Capital Group shareholders are down 35% for the year (even including dividends), but the market itself is up 5.2%. Even the share prices of good stocks drop sometimes, but we want to see improvements in the fundamental metrics of a business, before getting too interested. Unfortunately, last year's performance may indicate unresolved challenges, given that it was worse than the annualised loss of 5% over the last half decade. We realise that Baron Rothschild has said investors should "buy when there is blood on the streets", but we caution that investors should first be sure they are buying a high quality business. It's always interesting to track share price performance over the longer term. But to understand 360 Capital Group better, we need to consider many other factors. Case in point: We've spotted 2 warning signs for 360 Capital Group you should be aware of, and 1 of them is a bit unpleasant.
360 Capital Group is not the only stock that insiders are buying. For those who like to find winning investments this free list of growing companies with recent insider purchasing, could be just the ticket.
Please note, the market returns quoted in this article reflect the market weighted average returns of stocks that currently trade on Australian exchanges.
Valuation is complex, but we're here to simplify it.
Discover if 360 Capital Group might be undervalued or overvalued with our detailed analysis, featuring fair value estimates, potential risks, dividends, insider trades, and its financial condition.
Access Free AnalysisHave feedback on this article? Concerned about the content? Get in touch with us directly. Alternatively, email editorial-team (at) simplywallst.com.
This article by Simply Wall St is general in nature. We provide commentary based on historical data and analyst forecasts only using an unbiased methodology and our articles are not intended to be financial advice. It does not constitute a recommendation to buy or sell any stock, and does not take account of your objectives, or your financial situation. We aim to bring you long-term focused analysis driven by fundamental data. Note that our analysis may not factor in the latest price-sensitive company announcements or qualitative material. Simply Wall St has no position in any stocks mentioned.
About ASX:TGP
360 Capital Group
The Group is an ASX-listed, investment and funds management group, focused on strategic and active investment management of real estate assets.
Adequate balance sheet slight.

