- Australia
- /
- Capital Markets
- /
- ASX:PPT
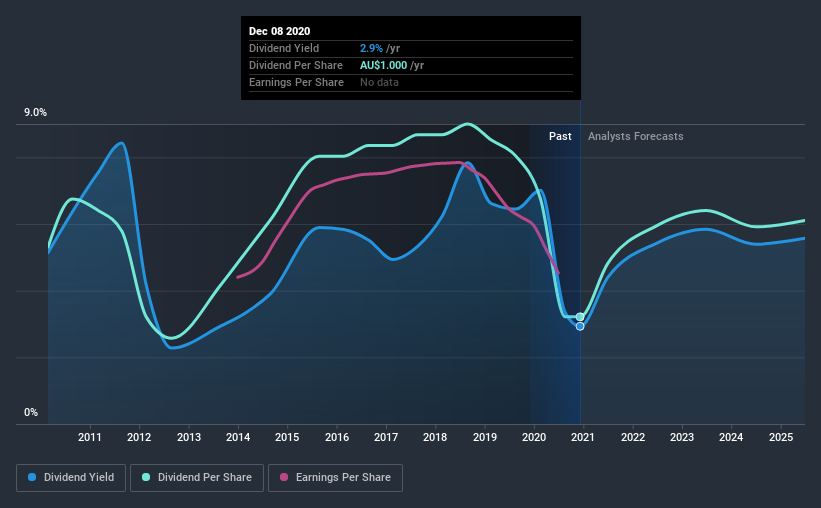
Do Investors Have Good Reason To Be Wary Of Perpetual Limited's (ASX:PPT) 2.9% Dividend Yield?


Could Perpetual Limited (ASX:PPT) be an attractive dividend share to own for the long haul? Investors are often drawn to strong companies with the idea of reinvesting the dividends. Yet sometimes, investors buy a stock for its dividend and lose money because the share price falls by more than they earned in dividend payments.
A slim 2.9% yield is hard to get excited about, but the long payment history is respectable. At the right price, or with strong growth opportunities, Perpetual could have potential. Some simple analysis can reduce the risk of holding Perpetual for its dividend, and we'll focus on the most important aspects below.
Click the interactive chart for our full dividend analysis
Payout ratios
Companies (usually) pay dividends out of their earnings. If a company is paying more than it earns, the dividend might have to be cut. Comparing dividend payments to a company's net profit after tax is a simple way of reality-checking whether a dividend is sustainable. Looking at the data, we can see that 88% of Perpetual's profits were paid out as dividends in the last 12 months. Paying out a majority of its earnings limits the amount that can be reinvested in the business. This may indicate a commitment to paying a dividend, or a dearth of investment opportunities.
We update our data on Perpetual every 24 hours, so you can always get our latest analysis of its financial health, here.
Dividend Volatility
Before buying a stock for its income, we want to see if the dividends have been stable in the past, and if the company has a track record of maintaining its dividend. For the purpose of this article, we only scrutinise the last decade of Perpetual's dividend payments. This dividend has been unstable, which we define as having been cut one or more times over this time. During the past 10-year period, the first annual payment was AU$1.7 in 2010, compared to AU$1.0 last year. This works out to be a decline of approximately 4.9% per year over that time. Perpetual's dividend hasn't shrunk linearly at 4.9% per annum, but the CAGR is a useful estimate of the historical rate of change.
When a company's per-share dividend falls we question if this reflects poorly on either external business conditions, or the company's capital allocation decisions. Either way, we find it hard to get excited about a company with a declining dividend.
Dividend Growth Potential
Given that the dividend has been cut in the past, we need to check if earnings are growing and if that might lead to stronger dividends in the future. Over the past five years, it looks as though Perpetual's EPS have declined at around 8.4% a year. A modest decline in earnings per share is not great to see, but it doesn't automatically make a dividend unsustainable. Still, we'd vastly prefer to see EPS growth when researching dividend stocks.
Conclusion
Dividend investors should always want to know if a) a company's dividends are affordable, b) if there is a track record of consistent payments, and c) if the dividend is capable of growing. Perpetual's payout ratio is within normal bounds. Second, earnings per share have been in decline, and its dividend has been cut at least once in the past. To conclude, we've spotted a couple of potential concerns with Perpetual that may make it less than ideal candidate for dividend investors.
Investors generally tend to favour companies with a consistent, stable dividend policy as opposed to those operating an irregular one. Still, investors need to consider a host of other factors, apart from dividend payments, when analysing a company. For example, we've picked out 2 warning signs for Perpetual that investors should know about before committing capital to this stock.
If you are a dividend investor, you might also want to look at our curated list of dividend stocks yielding above 3%.
If you decide to trade Perpetual, use the lowest-cost* platform that is rated #1 Overall by Barron’s, Interactive Brokers. Trade stocks, options, futures, forex, bonds and funds on 135 markets, all from a single integrated account. Promoted
New: Manage All Your Stock Portfolios in One Place
We've created the ultimate portfolio companion for stock investors, and it's free.
• Connect an unlimited number of Portfolios and see your total in one currency
• Be alerted to new Warning Signs or Risks via email or mobile
• Track the Fair Value of your stocks
This article by Simply Wall St is general in nature. It does not constitute a recommendation to buy or sell any stock, and does not take account of your objectives, or your financial situation. We aim to bring you long-term focused analysis driven by fundamental data. Note that our analysis may not factor in the latest price-sensitive company announcements or qualitative material. Simply Wall St has no position in any stocks mentioned.
*Interactive Brokers Rated Lowest Cost Broker by StockBrokers.com Annual Online Review 2020
Have feedback on this article? Concerned about the content? Get in touch with us directly. Alternatively, email editorial-team@simplywallst.com.
About ASX:PPT
Undervalued with moderate growth potential.
Similar Companies
Market Insights

Community Narratives

