
Advertisement
- Australia
- /
- Capital Markets
- /
- ASX:PCG
Pengana Capital Group Limited's (ASX:PCG) Price Is Right But Growth Is Lacking After Shares Rocket 29%

Pengana Capital Group Limited (ASX:PCG) shares have had a really impressive month, gaining 29% after a shaky period beforehand. Not all shareholders will be feeling jubilant, since the share price is still down a very disappointing 11% in the last twelve months.
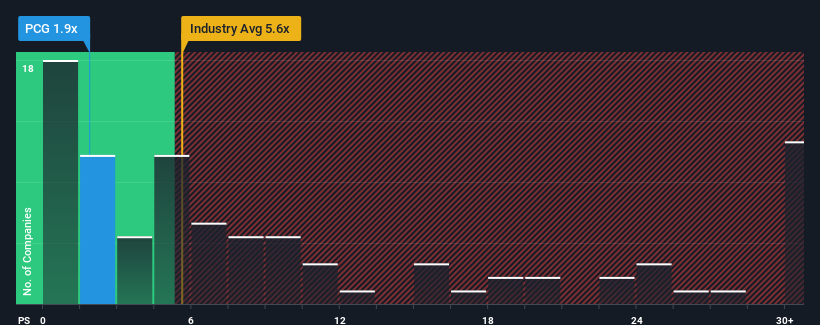
In spite of the firm bounce in price, Pengana Capital Group's price-to-sales (or "P/S") ratio of 1.9x might still make it look like a strong buy right now compared to the wider Capital Markets industry in Australia, where around half of the companies have P/S ratios above 5.6x and even P/S above 16x are quite common. Although, it's not wise to just take the P/S at face value as there may be an explanation why it's so limited.
View our latest analysis for Pengana Capital Group
What Does Pengana Capital Group's P/S Mean For Shareholders?
The recent revenue growth at Pengana Capital Group would have to be considered satisfactory if not spectacular. One possibility is that the P/S ratio is low because investors think this good revenue growth might actually underperform the broader industry in the near future. If that doesn't eventuate, then existing shareholders may have reason to be optimistic about the future direction of the share price.
We don't have analyst forecasts, but you can see how recent trends are setting up the company for the future by checking out our free report on Pengana Capital Group's earnings, revenue and cash flow.Do Revenue Forecasts Match The Low P/S Ratio?
Pengana Capital Group's P/S ratio would be typical for a company that's expected to deliver very poor growth or even falling revenue, and importantly, perform much worse than the industry.
If we review the last year of revenue growth, the company posted a worthy increase of 5.8%. Ultimately though, it couldn't turn around the poor performance of the prior period, with revenue shrinking 44% in total over the last three years. Accordingly, shareholders would have felt downbeat about the medium-term rates of revenue growth.
Weighing that medium-term revenue trajectory against the broader industry's one-year forecast for expansion of 6.8% shows it's an unpleasant look.
With this in mind, we understand why Pengana Capital Group's P/S is lower than most of its industry peers. Nonetheless, there's no guarantee the P/S has reached a floor yet with revenue going in reverse. There's potential for the P/S to fall to even lower levels if the company doesn't improve its top-line growth.
What Does Pengana Capital Group's P/S Mean For Investors?
Pengana Capital Group's recent share price jump still sees fails to bring its P/S alongside the industry median. While the price-to-sales ratio shouldn't be the defining factor in whether you buy a stock or not, it's quite a capable barometer of revenue expectations.
As we suspected, our examination of Pengana Capital Group revealed its shrinking revenue over the medium-term is contributing to its low P/S, given the industry is set to grow. Right now shareholders are accepting the low P/S as they concede future revenue probably won't provide any pleasant surprises either. Given the current circumstances, it seems unlikely that the share price will experience any significant movement in either direction in the near future if recent medium-term revenue trends persist.
Plus, you should also learn about these 2 warning signs we've spotted with Pengana Capital Group (including 1 which is concerning).
Of course, profitable companies with a history of great earnings growth are generally safer bets. So you may wish to see this free collection of other companies that have reasonable P/E ratios and have grown earnings strongly.
New: Manage All Your Stock Portfolios in One Place
We've created the ultimate portfolio companion for stock investors, and it's free.
• Connect an unlimited number of Portfolios and see your total in one currency
• Be alerted to new Warning Signs or Risks via email or mobile
• Track the Fair Value of your stocks
Have feedback on this article? Concerned about the content? Get in touch with us directly. Alternatively, email editorial-team (at) simplywallst.com.
This article by Simply Wall St is general in nature. We provide commentary based on historical data and analyst forecasts only using an unbiased methodology and our articles are not intended to be financial advice. It does not constitute a recommendation to buy or sell any stock, and does not take account of your objectives, or your financial situation. We aim to bring you long-term focused analysis driven by fundamental data. Note that our analysis may not factor in the latest price-sensitive company announcements or qualitative material. Simply Wall St has no position in any stocks mentioned.
About ASX:PCG
Pengana Capital Group
Pengana Holdings Pty Ltd. is a publicly owned investment manager.
Flawless balance sheet with reasonable growth potential.
Similar Companies
Market Insights

Advertisement
Community Narratives
Groundbreaking therapies that could change the treatment landscape for PTSD, fibromyalgia, MS & Alzheimer’s
Fair Value US$6.20|86.9% undervalued
CM
Community Contributor
DigitalOcean Will Grow 14% by Embracing AI with Paperspace Acquisition
Fair Value US$50.00|40.2% undervalued
NE
Community Contributor
Viant Technology: A Rising AdTech Challenger in the AI-Powered CTV Market
Fair Value US$38.61|62.7% undervalued
BL
Community Contributor
Volvo will Accelerate Forward into Electric and Autonomous Leadership in Five Years
Fair Value SEK 438.80|40.1% undervalued
UN
Community Contributor