
Advertisement
- Australia
- /
- Capital Markets
- /
- ASX:NGI
What Type Of Returns Would Navigator Global Investments'(ASX:NGI) Shareholders Have Earned If They Purchased Their Shares Three Years Ago?

Investing in stocks inevitably means buying into some companies that perform poorly. But long term Navigator Global Investments Limited (ASX:NGI) shareholders have had a particularly rough ride in the last three year. Sadly for them, the share price is down 67% in that time.
See our latest analysis for Navigator Global Investments
While markets are a powerful pricing mechanism, share prices reflect investor sentiment, not just underlying business performance. One flawed but reasonable way to assess how sentiment around a company has changed is to compare the earnings per share (EPS) with the share price.
During five years of share price growth, Navigator Global Investments moved from a loss to profitability. We would usually expect to see the share price rise as a result. So given the share price is down it's worth checking some other metrics too.
It's quite likely that the declining dividend has caused some investors to sell their shares, pushing the price lower in the process. In contrast it does not seem particularly likely that the revenue levels are a concern for investors.
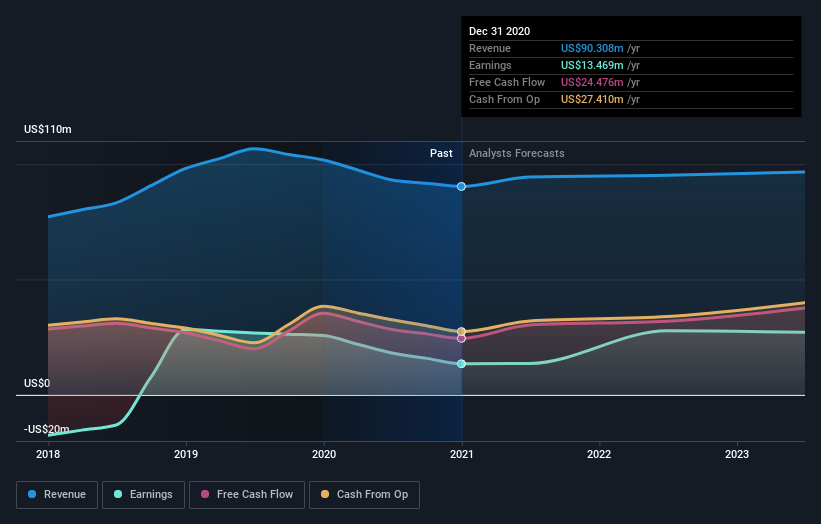
The graphic below depicts how earnings and revenue have changed over time (unveil the exact values by clicking on the image).
We know that Navigator Global Investments has improved its bottom line over the last three years, but what does the future have in store? Take a more thorough look at Navigator Global Investments' financial health with this free report on its balance sheet.
What About Dividends?
When looking at investment returns, it is important to consider the difference between total shareholder return (TSR) and share price return. Whereas the share price return only reflects the change in the share price, the TSR includes the value of dividends (assuming they were reinvested) and the benefit of any discounted capital raising or spin-off. It's fair to say that the TSR gives a more complete picture for stocks that pay a dividend. We note that for Navigator Global Investments the TSR over the last 3 years was -60%, which is better than the share price return mentioned above. And there's no prize for guessing that the dividend payments largely explain the divergence!
A Different Perspective
Navigator Global Investments shareholders gained a total return of 19% during the year. But that return falls short of the market. On the bright side, that's still a gain, and it is certainly better than the yearly loss of about 0.6% endured over half a decade. So this might be a sign the business has turned its fortunes around. I find it very interesting to look at share price over the long term as a proxy for business performance. But to truly gain insight, we need to consider other information, too. Case in point: We've spotted 3 warning signs for Navigator Global Investments you should be aware of.
We will like Navigator Global Investments better if we see some big insider buys. While we wait, check out this free list of growing companies with considerable, recent, insider buying.
Please note, the market returns quoted in this article reflect the market weighted average returns of stocks that currently trade on AU exchanges.
If you’re looking to trade Navigator Global Investments, open an account with the lowest-cost* platform trusted by professionals, Interactive Brokers. Their clients from over 200 countries and territories trade stocks, options, futures, forex, bonds and funds worldwide from a single integrated account. Promoted
Valuation is complex, but we're here to simplify it.
Discover if Navigator Global Investments might be undervalued or overvalued with our detailed analysis, featuring fair value estimates, potential risks, dividends, insider trades, and its financial condition.
Access Free AnalysisThis article by Simply Wall St is general in nature. It does not constitute a recommendation to buy or sell any stock, and does not take account of your objectives, or your financial situation. We aim to bring you long-term focused analysis driven by fundamental data. Note that our analysis may not factor in the latest price-sensitive company announcements or qualitative material. Simply Wall St has no position in any stocks mentioned.
*Interactive Brokers Rated Lowest Cost Broker by StockBrokers.com Annual Online Review 2020
Have feedback on this article? Concerned about the content? Get in touch with us directly. Alternatively, email editorial-team (at) simplywallst.com.
About ASX:NGI
Navigator Global Investments
HFA Holdings Limited operates as a fund management company in Australia.
Very undervalued with excellent balance sheet.
Market Insights


Advertisement
Community Narratives
For the Emperor: Why Games Workshop Could Be a Star Investment
Fair Value UK£160.00|0.4% overvalued
RO
Community Contributor
Securitas will boost margins with AI and tech-driven services
Fair Value SEK 260.91|44.5% undervalued
UN
Community Contributor
A Leader in EV Charging with Growth Potential
Fair Value €27.00|17.8% undervalued
TI
Community Contributor