
Advertisement
- Australia
- /
- Diversified Financial
- /
- ASX:IAM
Positive Sentiment Still Eludes Income Asset Management Group Limited (ASX:IAM) Following 27% Share Price Slump
Unfortunately for some shareholders, the Income Asset Management Group Limited (ASX:IAM) share price has dived 27% in the last thirty days, prolonging recent pain. For any long-term shareholders, the last month ends a year to forget by locking in a 79% share price decline.
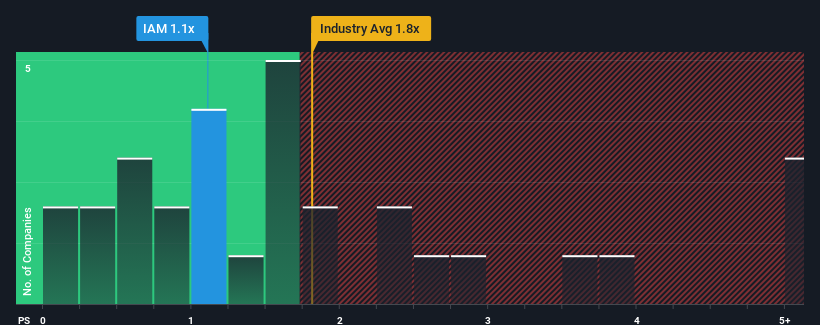
In spite of the heavy fall in price, you could still be forgiven for feeling indifferent about Income Asset Management Group's P/S ratio of 1.1x, since the median price-to-sales (or "P/S") ratio for the Diversified Financial industry in Australia is also close to 1.6x. Although, it's not wise to simply ignore the P/S without explanation as investors may be disregarding a distinct opportunity or a costly mistake.
See our latest analysis for Income Asset Management Group
How Income Asset Management Group Has Been Performing
There hasn't been much to differentiate Income Asset Management Group's and the industry's revenue growth lately. The P/S ratio is probably moderate because investors think this modest revenue performance will continue. If this is the case, then at least existing shareholders won't be losing sleep over the current share price.
Want the full picture on analyst estimates for the company? Then our free report on Income Asset Management Group will help you uncover what's on the horizon.How Is Income Asset Management Group's Revenue Growth Trending?
The only time you'd be comfortable seeing a P/S like Income Asset Management Group's is when the company's growth is tracking the industry closely.
Retrospectively, the last year delivered an exceptional 22% gain to the company's top line. The strong recent performance means it was also able to grow revenue by 156% in total over the last three years. Therefore, it's fair to say the revenue growth recently has been superb for the company.
Turning to the outlook, the next year should demonstrate the company's robustness, generating growth of 22% as estimated by the lone analyst watching the company. Meanwhile, the broader industry is forecast to contract by 27%, which would indicate the company is doing very well.
With this information, we find it odd that Income Asset Management Group is trading at a fairly similar P/S to the industry. Apparently some shareholders are skeptical of the contrarian forecasts and have been accepting lower selling prices.
What Does Income Asset Management Group's P/S Mean For Investors?
Income Asset Management Group's plummeting stock price has brought its P/S back to a similar region as the rest of the industry. It's argued the price-to-sales ratio is an inferior measure of value within certain industries, but it can be a powerful business sentiment indicator.
We've established that Income Asset Management Group currently trades on a lower than expected P/S since its growth forecasts are potentially beating a struggling industry. There could be some unobserved threats to revenue preventing the P/S ratio from matching the positive outlook. One such risk is that the company may not live up to analysts' revenue trajectories in tough industry conditions. At least the risk of a price drop looks to be subdued, but investors seem to think future revenue could see some volatility.
We don't want to rain on the parade too much, but we did also find 4 warning signs for Income Asset Management Group (1 is potentially serious!) that you need to be mindful of.
Of course, profitable companies with a history of great earnings growth are generally safer bets. So you may wish to see this free collection of other companies that have reasonable P/E ratios and have grown earnings strongly.
New: AI Stock Screener & Alerts
Our new AI Stock Screener scans the market every day to uncover opportunities.
• Dividend Powerhouses (3%+ Yield)
• Undervalued Small Caps with Insider Buying
• High growth Tech and AI Companies
Or build your own from over 50 metrics.
Have feedback on this article? Concerned about the content? Get in touch with us directly. Alternatively, email editorial-team (at) simplywallst.com.
This article by Simply Wall St is general in nature. We provide commentary based on historical data and analyst forecasts only using an unbiased methodology and our articles are not intended to be financial advice. It does not constitute a recommendation to buy or sell any stock, and does not take account of your objectives, or your financial situation. We aim to bring you long-term focused analysis driven by fundamental data. Note that our analysis may not factor in the latest price-sensitive company announcements or qualitative material. Simply Wall St has no position in any stocks mentioned.
About ASX:IAM
Income Asset Management Group
Provides financial product solutions in cash/deposits and fixed income in Australia.
Exceptional growth potential with adequate balance sheet.
Market Insights

Advertisement
Community Narratives
MicroVision will explode future revenue by 380.37% with a vision towards success
Fair Value US$60|98.4% undervalued
TH
Community Contributor
The Indispensable Artery for a New North American Economy
Fair Value CA$132.87|0.7% overvalued
TI
Community Contributor
Recently Updated Narratives
CE

cementafriend on Constellation Energy ·
Constellation Energy Dividends and Growth
Fair Value:US$348.054.7% overvalued
2 followersusers have followed this narrative
0 commentsusers have commented on this narrative
0 likesusers have liked this narrative
KH

Khagani on CoreWeave ·
CoreWeave's Revenue Expected to Rocket 77.88% in 5-Year Forecast
Fair Value:US$11033.5% undervalued
1 followerusers have followed this narrative
0 commentsusers have commented on this narrative
0 likesusers have liked this narrative
PO

PortfolioPlus on Bisalloy Steel Group ·
Bisalloy Steel Group will shine with a projected profit margin increase of 12.8%
Fair Value:AU$6.7118.0% undervalued
2 followersusers have followed this narrative
0 commentsusers have commented on this narrative
0 likesusers have liked this narrative
Popular Narratives
TH

TheWallstreetKing on MicroVision ·
MicroVision will explode future revenue by 380.37% with a vision towards success
Fair Value:US$6098.4% undervalued
101 followersusers have followed this narrative
10 commentsusers have commented on this narrative
20 likesusers have liked this narrative
AN


AnalystConsensusTarget on NVIDIA ·
NVDA: Expanding AI Demand Will Drive Major Data Center Investments Through 2026
Fair Value:US$250.3929.3% undervalued
935 followersusers have followed this narrative
6 commentsusers have commented on this narrative
23 likesusers have liked this narrative
OS


oscargarcia on Alphabet ·
The company that turned a verb into a global necessity and basically runs the modern internet, digital ads, smartphones, maps, and AI.
Fair Value:US$3405.8% undervalued
140 followersusers have followed this narrative
6 commentsusers have commented on this narrative
18 likesusers have liked this narrative