
Advertisement
- Australia
- /
- Diversified Financial
- /
- ASX:FTC
FinTech Chain Full Year 2023 Earnings: CN¥0.006 loss per share (vs CN¥0.002 profit in FY 2022)

FinTech Chain (ASX:FTC) Full Year 2023 Results
Key Financial Results
- Revenue: CN¥58.6m (down 9.1% from FY 2022).
- Net loss: CN¥3.94m (down by 351% from CN¥1.57m profit in FY 2022).
- CN¥0.006 loss per share (down from CN¥0.002 profit in FY 2022).
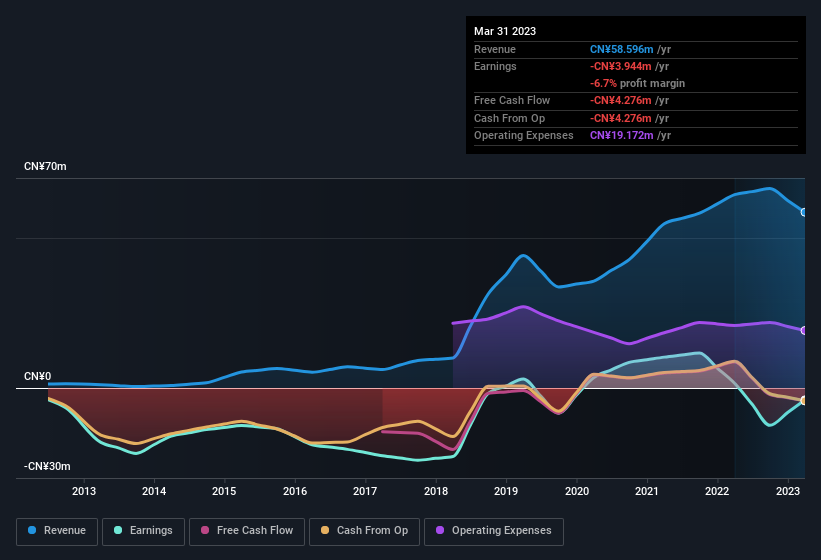
All figures shown in the chart above are for the trailing 12 month (TTM) period
FinTech Chain shares are up 46% from a week ago.
Risk Analysis
We don't want to rain on the parade too much, but we did also find 3 warning signs for FinTech Chain that you need to be mindful of.
New: AI Stock Screener & Alerts
Our new AI Stock Screener scans the market every day to uncover opportunities.
• Dividend Powerhouses (3%+ Yield)
• Undervalued Small Caps with Insider Buying
• High growth Tech and AI Companies
Or build your own from over 50 metrics.
Have feedback on this article? Concerned about the content? Get in touch with us directly. Alternatively, email editorial-team (at) simplywallst.com.
This article by Simply Wall St is general in nature. We provide commentary based on historical data and analyst forecasts only using an unbiased methodology and our articles are not intended to be financial advice. It does not constitute a recommendation to buy or sell any stock, and does not take account of your objectives, or your financial situation. We aim to bring you long-term focused analysis driven by fundamental data. Note that our analysis may not factor in the latest price-sensitive company announcements or qualitative material. Simply Wall St has no position in any stocks mentioned.
About ASX:FTC
FinTech Chain
An investment holding company, engages in the provision of system development and information technology services in the People’s Republic of China.
Slight and slightly overvalued.
Market Insights

Advertisement
Community Narratives
Groundbreaking therapies that could change the treatment landscape for PTSD, fibromyalgia, MS & Alzheimer’s
Fair Value US$6.20|86.9% undervalued
CM
Community Contributor
DigitalOcean Will Grow 14% by Embracing AI with Paperspace Acquisition
Fair Value US$50.00|41.7% undervalued
NE
Community Contributor
Viant Technology: A Rising AdTech Challenger in the AI-Powered CTV Market
Fair Value US$38.61|63.2% undervalued
BL
Community Contributor
Volvo will Accelerate Forward into Electric and Autonomous Leadership in Five Years
Fair Value SEK 438.80|39.7% undervalued
UN
Community Contributor