- Australia
- /
- Capital Markets
- /
- ASX:AFI
Australian Foundation Investment's (ASX:AFI) investors will be pleased with their respectable 47% return over the last five years


If you buy and hold a stock for many years, you'd hope to be making a profit. Better yet, you'd like to see the share price move up more than the market average. But Australian Foundation Investment Company Limited (ASX:AFI) has fallen short of that second goal, with a share price rise of 25% over five years, which is below the market return. Zooming in, the stock is up just 1.0% in the last year.
So let's investigate and see if the longer term performance of the company has been in line with the underlying business' progress.
See our latest analysis for Australian Foundation Investment
While markets are a powerful pricing mechanism, share prices reflect investor sentiment, not just underlying business performance. One flawed but reasonable way to assess how sentiment around a company has changed is to compare the earnings per share (EPS) with the share price.
During five years of share price growth, Australian Foundation Investment actually saw its EPS drop 5.9% per year.
Since the EPS are down strongly, it seems highly unlikely market participants are looking at EPS to value the company. The falling EPS doesn't correlate with the climbing share price, so it's worth taking a look at other metrics.
The revenue reduction of 0.2% per year is not a positive. It certainly surprises us that the share price is up, but perhaps a closer examination of the data will yield answers.
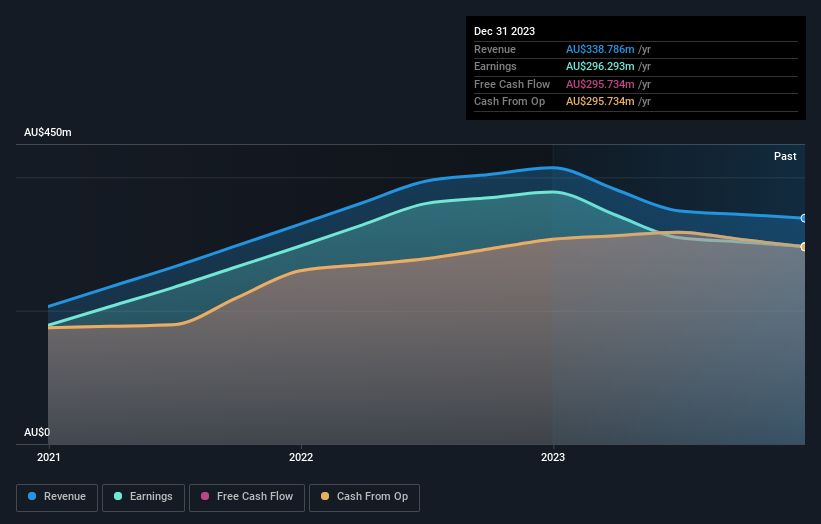
The image below shows how earnings and revenue have tracked over time (if you click on the image you can see greater detail).
It's good to see that there was some significant insider buying in the last three months. That's a positive. On the other hand, we think the revenue and earnings trends are much more meaningful measures of the business. It might be well worthwhile taking a look at our free report on Australian Foundation Investment's earnings, revenue and cash flow.
What About Dividends?
When looking at investment returns, it is important to consider the difference between total shareholder return (TSR) and share price return. Whereas the share price return only reflects the change in the share price, the TSR includes the value of dividends (assuming they were reinvested) and the benefit of any discounted capital raising or spin-off. It's fair to say that the TSR gives a more complete picture for stocks that pay a dividend. We note that for Australian Foundation Investment the TSR over the last 5 years was 47%, which is better than the share price return mentioned above. This is largely a result of its dividend payments!
A Different Perspective
Australian Foundation Investment shareholders gained a total return of 4.6% during the year. But that was short of the market average. If we look back over five years, the returns are even better, coming in at 8% per year for five years. It may well be that this is a business worth popping on the watching, given the continuing positive reception, over time, from the market. I find it very interesting to look at share price over the long term as a proxy for business performance. But to truly gain insight, we need to consider other information, too. Consider risks, for instance. Every company has them, and we've spotted 2 warning signs for Australian Foundation Investment you should know about.
There are plenty of other companies that have insiders buying up shares. You probably do not want to miss this free list of growing companies that insiders are buying.
Please note, the market returns quoted in this article reflect the market weighted average returns of stocks that currently trade on Australian exchanges.
New: Manage All Your Stock Portfolios in One Place
We've created the ultimate portfolio companion for stock investors, and it's free.
• Connect an unlimited number of Portfolios and see your total in one currency
• Be alerted to new Warning Signs or Risks via email or mobile
• Track the Fair Value of your stocks
Have feedback on this article? Concerned about the content? Get in touch with us directly. Alternatively, email editorial-team (at) simplywallst.com.
This article by Simply Wall St is general in nature. We provide commentary based on historical data and analyst forecasts only using an unbiased methodology and our articles are not intended to be financial advice. It does not constitute a recommendation to buy or sell any stock, and does not take account of your objectives, or your financial situation. We aim to bring you long-term focused analysis driven by fundamental data. Note that our analysis may not factor in the latest price-sensitive company announcements or qualitative material. Simply Wall St has no position in any stocks mentioned.
About ASX:AFI
Adequate balance sheet second-rate dividend payer.
