- Australia
- /
- Diversified Financial
- /
- ASX:8IH
8I Holdings Limited (ASX:8IH) Stock's 47% Dive Might Signal An Opportunity But It Requires Some Scrutiny


8I Holdings Limited (ASX:8IH) shares have had a horrible month, losing 47% after a relatively good period beforehand. The recent drop completes a disastrous twelve months for shareholders, who are sitting on a 80% loss during that time.
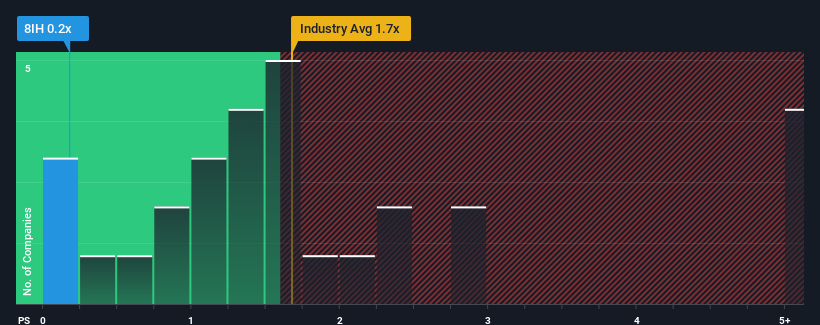
After such a large drop in price, considering around half the companies operating in Australia's Diversified Financial industry have price-to-sales ratios (or "P/S") above 1.5x, you may consider 8I Holdings as an solid investment opportunity with its 0.2x P/S ratio. Nonetheless, we'd need to dig a little deeper to determine if there is a rational basis for the reduced P/S.
Check out our latest analysis for 8I Holdings
How Has 8I Holdings Performed Recently?
8I Holdings certainly has been doing a great job lately as it's been growing its revenue at a really rapid pace. One possibility is that the P/S ratio is low because investors think this strong revenue growth might actually underperform the broader industry in the near future. If that doesn't eventuate, then existing shareholders have reason to be quite optimistic about the future direction of the share price.
Want the full picture on earnings, revenue and cash flow for the company? Then our free report on 8I Holdings will help you shine a light on its historical performance.Do Revenue Forecasts Match The Low P/S Ratio?
In order to justify its P/S ratio, 8I Holdings would need to produce sluggish growth that's trailing the industry.
Taking a look back first, we see that the company grew revenue by an impressive 75% last year. Still, revenue has fallen 31% in total from three years ago, which is quite disappointing. Accordingly, shareholders would have felt downbeat about the medium-term rates of revenue growth.
Comparing that to the industry, which is predicted to shrink 30% in the next 12 months, the company's downward momentum is still superior based on recent medium-term annualised revenue results.
In light of this, the fact 8I Holdings' P/S sits below the majority of other companies is peculiar but certainly not shocking. Even if the company's recent growth rates continue outperforming the industry, shrinking revenues are unlikely to lead to a stable P/S long-term. There is still potential for the P/S to fall to even lower levels if the company doesn't improve its top-line growth, which would be difficult to do with the current industry outlook.
What Does 8I Holdings' P/S Mean For Investors?
The southerly movements of 8I Holdings' shares means its P/S is now sitting at a pretty low level. It's argued the price-to-sales ratio is an inferior measure of value within certain industries, but it can be a powerful business sentiment indicator.
As we've mentioned, 8I Holdings' lower than industry P/S comes as a bit of a surprise due to its recent three-year revenue not being as bad as the forecasts for a struggling industry. There could be some major unobserved threats to revenue preventing the P/S ratio from matching this comparatively more attractive revenue performance. We'd hazard a guess that some investors are concerned about the company's revenue performance tailing off amidst these tough industry conditions. While recent medium-term revenue trends suggest that the risk of a price decline is low, investors appear to perceive a possibility of revenue volatility in the future.
And what about other risks? Every company has them, and we've spotted 1 warning sign for 8I Holdings you should know about.
It's important to make sure you look for a great company, not just the first idea you come across. So if growing profitability aligns with your idea of a great company, take a peek at this free list of interesting companies with strong recent earnings growth (and a low P/E).
If you're looking to trade 8I Holdings, open an account with the lowest-cost platform trusted by professionals, Interactive Brokers.
With clients in over 200 countries and territories, and access to 160 markets, IBKR lets you trade stocks, options, futures, forex, bonds and funds from a single integrated account.
Enjoy no hidden fees, no account minimums, and FX conversion rates as low as 0.03%, far better than what most brokers offer.
Sponsored ContentNew: Manage All Your Stock Portfolios in One Place
We've created the ultimate portfolio companion for stock investors, and it's free.
• Connect an unlimited number of Portfolios and see your total in one currency
• Be alerted to new Warning Signs or Risks via email or mobile
• Track the Fair Value of your stocks
Have feedback on this article? Concerned about the content? Get in touch with us directly. Alternatively, email editorial-team (at) simplywallst.com.
This article by Simply Wall St is general in nature. We provide commentary based on historical data and analyst forecasts only using an unbiased methodology and our articles are not intended to be financial advice. It does not constitute a recommendation to buy or sell any stock, and does not take account of your objectives, or your financial situation. We aim to bring you long-term focused analysis driven by fundamental data. Note that our analysis may not factor in the latest price-sensitive company announcements or qualitative material. Simply Wall St has no position in any stocks mentioned.
About ASX:8IH
8I Holdings
An investment holding company, engages in the financial education technology business in Singapore, Malaysia, and China.
Flawless balance sheet slight.

