- Australia
- /
- Consumer Services
- /
- ASX:IEL
Are Investors Undervaluing IDP Education Limited (ASX:IEL) By 35%?


Key Insights
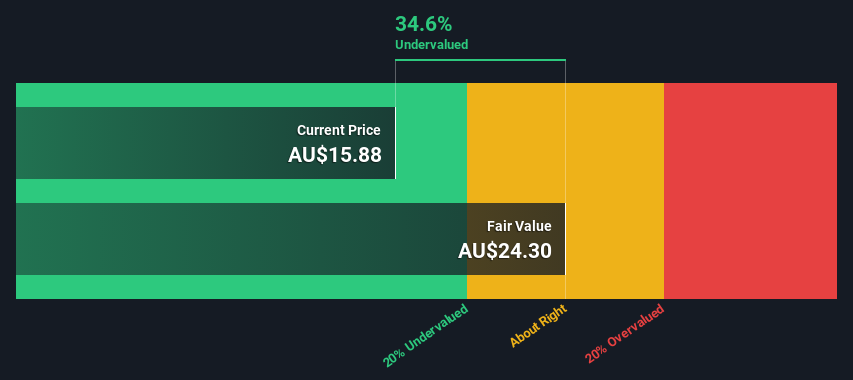
- IDP Education's estimated fair value is AU$24.30 based on 2 Stage Free Cash Flow to Equity
- Current share price of AU$15.88 suggests IDP Education is potentially 35% undervalued
- Analyst price target for IEL is AU$21.29 which is 12% below our fair value estimate
Today we will run through one way of estimating the intrinsic value of IDP Education Limited (ASX:IEL) by taking the expected future cash flows and discounting them to today's value. The Discounted Cash Flow (DCF) model is the tool we will apply to do this. There's really not all that much to it, even though it might appear quite complex.
Companies can be valued in a lot of ways, so we would point out that a DCF is not perfect for every situation. If you want to learn more about discounted cash flow, the rationale behind this calculation can be read in detail in the Simply Wall St analysis model.
View our latest analysis for IDP Education
What's The Estimated Valuation?
We are going to use a two-stage DCF model, which, as the name states, takes into account two stages of growth. The first stage is generally a higher growth period which levels off heading towards the terminal value, captured in the second 'steady growth' period. In the first stage we need to estimate the cash flows to the business over the next ten years. Where possible we use analyst estimates, but when these aren't available we extrapolate the previous free cash flow (FCF) from the last estimate or reported value. We assume companies with shrinking free cash flow will slow their rate of shrinkage, and that companies with growing free cash flow will see their growth rate slow, over this period. We do this to reflect that growth tends to slow more in the early years than it does in later years.
A DCF is all about the idea that a dollar in the future is less valuable than a dollar today, so we need to discount the sum of these future cash flows to arrive at a present value estimate:
10-year free cash flow (FCF) estimate
| 2024 | 2025 | 2026 | 2027 | 2028 | 2029 | 2030 | 2031 | 2032 | 2033 | |
| Levered FCF (A$, Millions) | AU$134.9m | AU$193.2m | AU$232.4m | AU$274.0m | AU$293.4m | AU$308.2m | AU$321.2m | AU$332.8m | AU$343.5m | AU$353.6m |
| Growth Rate Estimate Source | Analyst x5 | Analyst x5 | Analyst x5 | Analyst x3 | Analyst x2 | Est @ 5.05% | Est @ 4.22% | Est @ 3.63% | Est @ 3.22% | Est @ 2.93% |
| Present Value (A$, Millions) Discounted @ 6.3% | AU$127 | AU$171 | AU$193 | AU$214 | AU$216 | AU$213 | AU$209 | AU$204 | AU$198 | AU$192 |
("Est" = FCF growth rate estimated by Simply Wall St)
Present Value of 10-year Cash Flow (PVCF) = AU$1.9b
We now need to calculate the Terminal Value, which accounts for all the future cash flows after this ten year period. For a number of reasons a very conservative growth rate is used that cannot exceed that of a country's GDP growth. In this case we have used the 5-year average of the 10-year government bond yield (2.3%) to estimate future growth. In the same way as with the 10-year 'growth' period, we discount future cash flows to today's value, using a cost of equity of 6.3%.
Terminal Value (TV)= FCF2033 × (1 + g) ÷ (r – g) = AU$354m× (1 + 2.3%) ÷ (6.3%– 2.3%) = AU$8.9b
Present Value of Terminal Value (PVTV)= TV / (1 + r)10= AU$8.9b÷ ( 1 + 6.3%)10= AU$4.8b
The total value, or equity value, is then the sum of the present value of the future cash flows, which in this case is AU$6.8b. The last step is to then divide the equity value by the number of shares outstanding. Relative to the current share price of AU$15.9, the company appears quite good value at a 35% discount to where the stock price trades currently. The assumptions in any calculation have a big impact on the valuation, so it is better to view this as a rough estimate, not precise down to the last cent.
Important Assumptions
The calculation above is very dependent on two assumptions. The first is the discount rate and the other is the cash flows. If you don't agree with these result, have a go at the calculation yourself and play with the assumptions. The DCF also does not consider the possible cyclicality of an industry, or a company's future capital requirements, so it does not give a full picture of a company's potential performance. Given that we are looking at IDP Education as potential shareholders, the cost of equity is used as the discount rate, rather than the cost of capital (or weighted average cost of capital, WACC) which accounts for debt. In this calculation we've used 6.3%, which is based on a levered beta of 0.883. Beta is a measure of a stock's volatility, compared to the market as a whole. We get our beta from the industry average beta of globally comparable companies, with an imposed limit between 0.8 and 2.0, which is a reasonable range for a stable business.
SWOT Analysis for IDP Education
- Earnings growth over the past year exceeded the industry.
- Debt is not viewed as a risk.
- Dividend is low compared to the top 25% of dividend payers in the Consumer Services market.
- Annual revenue is forecast to grow faster than the Australian market.
- Good value based on P/E ratio and estimated fair value.
- Dividends are not covered by cash flow.
- Annual earnings are forecast to grow slower than the Australian market.
Next Steps:
Valuation is only one side of the coin in terms of building your investment thesis, and it shouldn't be the only metric you look at when researching a company. The DCF model is not a perfect stock valuation tool. Preferably you'd apply different cases and assumptions and see how they would impact the company's valuation. For example, changes in the company's cost of equity or the risk free rate can significantly impact the valuation. What is the reason for the share price sitting below the intrinsic value? For IDP Education, there are three pertinent factors you should consider:
- Financial Health: Does IEL have a healthy balance sheet? Take a look at our free balance sheet analysis with six simple checks on key factors like leverage and risk.
- Management:Have insiders been ramping up their shares to take advantage of the market's sentiment for IEL's future outlook? Check out our management and board analysis with insights on CEO compensation and governance factors.
- Other High Quality Alternatives: Do you like a good all-rounder? Explore our interactive list of high quality stocks to get an idea of what else is out there you may be missing!
PS. The Simply Wall St app conducts a discounted cash flow valuation for every stock on the ASX every day. If you want to find the calculation for other stocks just search here.
If you're looking to trade IDP Education, open an account with the lowest-cost platform trusted by professionals, Interactive Brokers.
With clients in over 200 countries and territories, and access to 160 markets, IBKR lets you trade stocks, options, futures, forex, bonds and funds from a single integrated account.
Enjoy no hidden fees, no account minimums, and FX conversion rates as low as 0.03%, far better than what most brokers offer.
Sponsored ContentNew: AI Stock Screener & Alerts
Our new AI Stock Screener scans the market every day to uncover opportunities.
• Dividend Powerhouses (3%+ Yield)
• Undervalued Small Caps with Insider Buying
• High growth Tech and AI Companies
Or build your own from over 50 metrics.
Have feedback on this article? Concerned about the content? Get in touch with us directly. Alternatively, email editorial-team (at) simplywallst.com.
This article by Simply Wall St is general in nature. We provide commentary based on historical data and analyst forecasts only using an unbiased methodology and our articles are not intended to be financial advice. It does not constitute a recommendation to buy or sell any stock, and does not take account of your objectives, or your financial situation. We aim to bring you long-term focused analysis driven by fundamental data. Note that our analysis may not factor in the latest price-sensitive company announcements or qualitative material. Simply Wall St has no position in any stocks mentioned.
About ASX:IEL
IDP Education
Engages in the placement of students into education institutions in Australia, the United Kingdom, the United States, Canada, New Zealand, and Ireland.
Excellent balance sheet with reasonable growth potential.
Market Insights

Community Narratives

